

Standards Over Time Report: ASSISTments Plus Feature
Standards Over Time Report
⭐️ ASSISTments Plus Feature
This feature is available exclusively with ASSISTments Plus for Schools & Districts. Learn more here.
The Standards Over Time Report allows teachers to view class performance over time for a specific standard or set of standards. This report provides a clear picture of student performance, helping teachers identify learning gaps and monitor progress.
How to Access the Standards Over Time Report
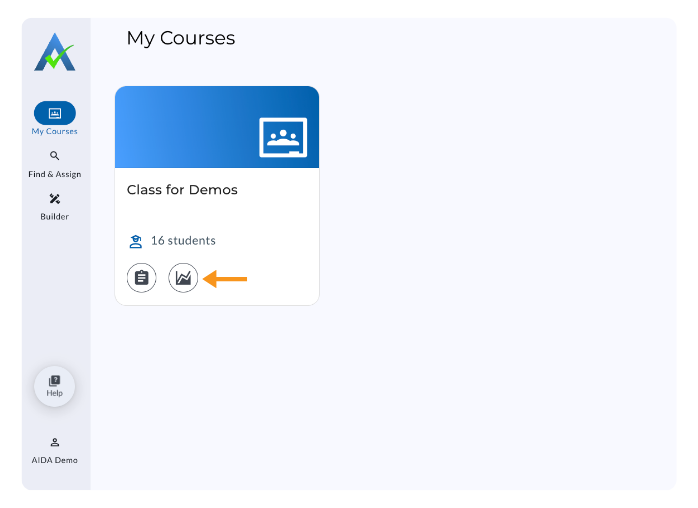
- Click the Report icon from the My Courses homepage.
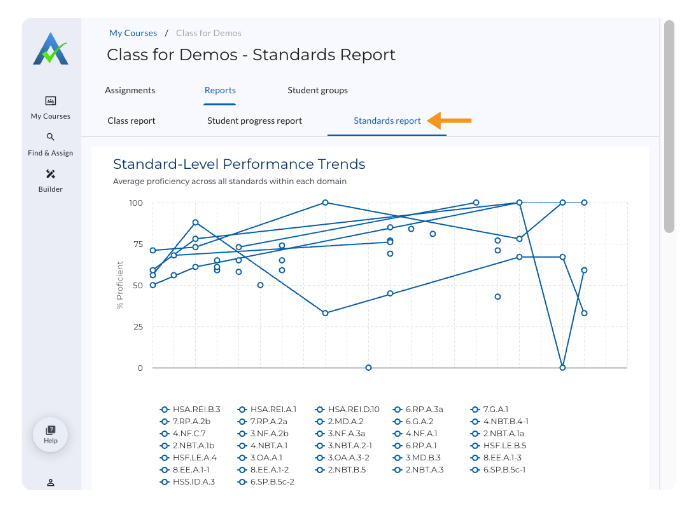
- Select the Standards report tab.
Understanding the Standards Report
The Standards Report includes a performance trend graph and a list of standards.
Standard-Level Performance Trends
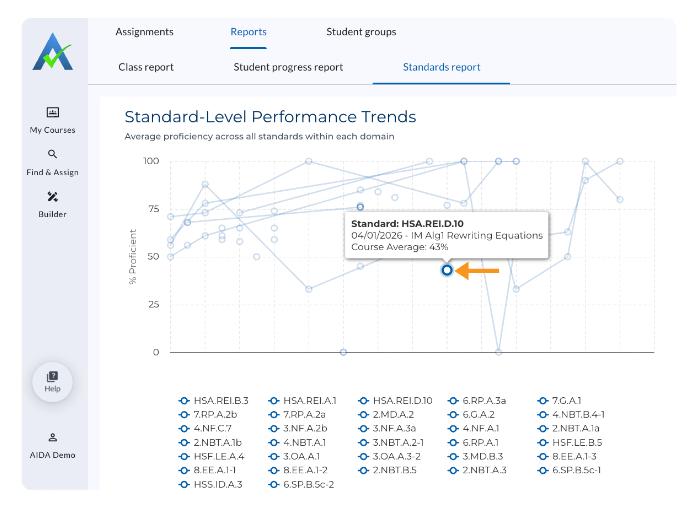
The Standard-Level Performance Trends graph shows the class average on standards over time.
- Each line represents a different standard that has been assigned to the class.
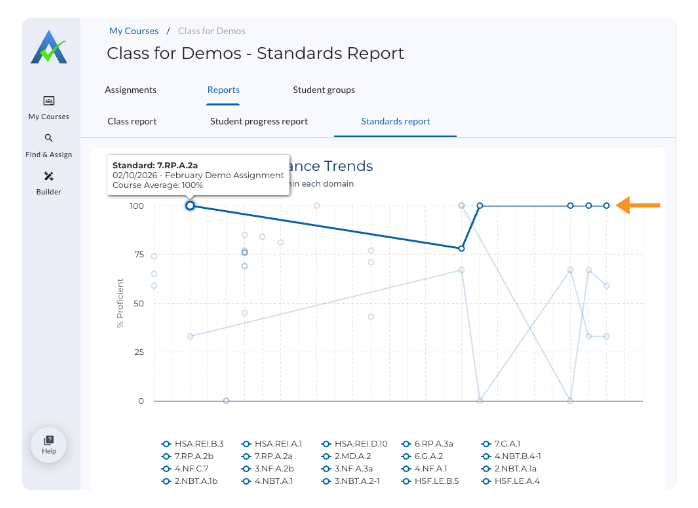
- Each point represents an assignment with that standard.
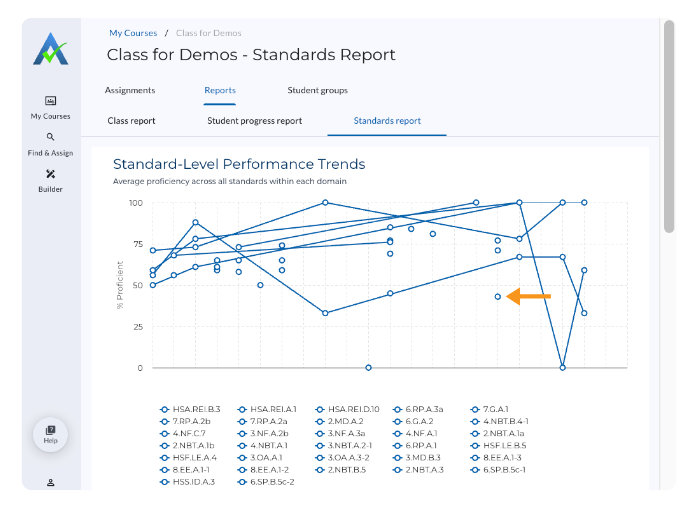
- Hover over a point to view the standard, assignment, and class average for that assignment.
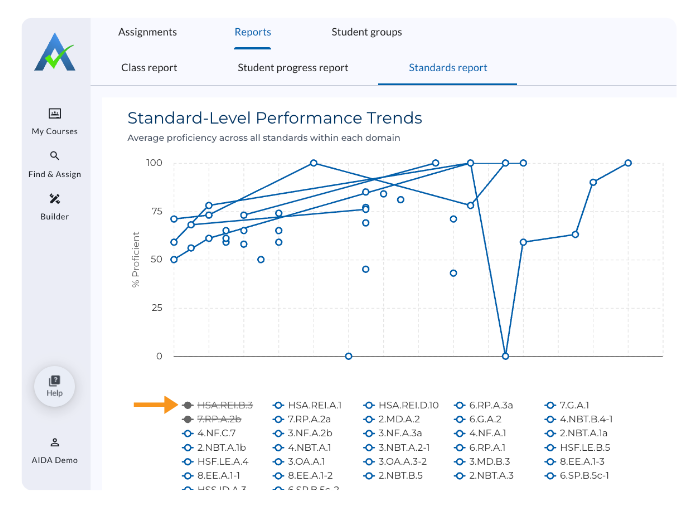
Below the graph is a list of standards that have been assigned to the class. Select a standard to remove it from the graph.
Filter Toolbox
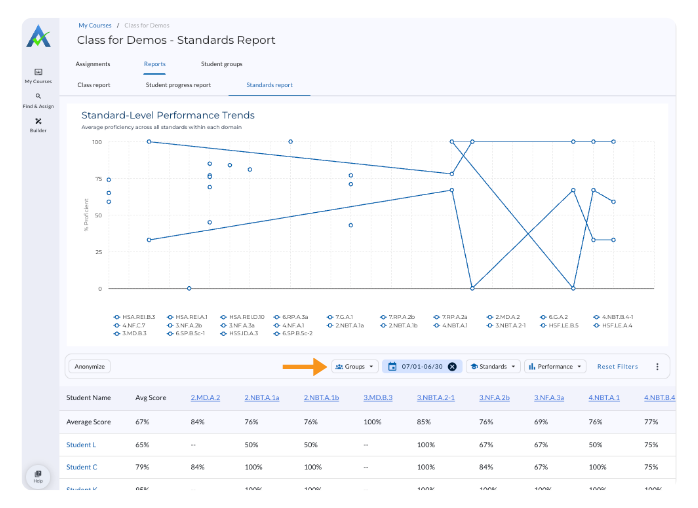
Use the Filter Toolbox to customize the Standards Report.
- Anonymize: Anonymize student names.
- Groups: Filter by student groups you have created. See Student Groups for more information.
- Date: Filter by date. The default is the current school year. If terms have been created, the default is the term that includes the present date.
- Standards: Select one or more standards to include in the report.
- Performance: Filter by the following performance levels:
- Equal to or greater than 80%
- 60–79%
- Less than 60%
- Triple dots (⫶): Download a CSV of the data in the table.
Select Reset Filters to remove all filters except the Date filter.
Standards Report Table
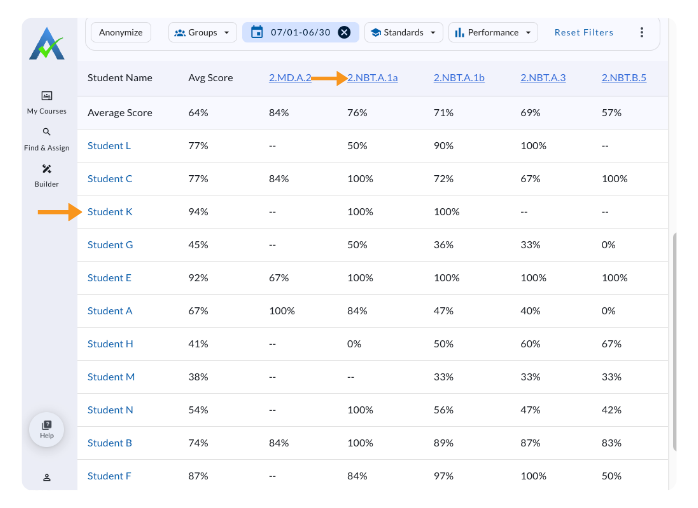
The Standards Report Table shows each student’s name, average score, and average score for each individual standard.
- Select a standard to open the Class Report for that standard.
- Select a student’s name to open the Student Progress Report.
Standards Over Time Report
⭐️ ASSISTments Plus Feature
This feature is available exclusively with ASSISTments Plus for Schools & Districts. Learn more here.
The Standards Over Time Report allows teachers to view class performance over time for a specific standard or set of standards. This report provides a clear picture of student performance, helping teachers identify learning gaps and monitor progress.
How to Access the Standards Over Time Report
- Click the Report icon from the My Courses homepage.
- Select the Standards report tab.
Understanding the Standards Report
The Standards Report includes a performance trend graph and a list of standards.
Standard-Level Performance Trends
The Standard-Level Performance Trends graph shows the class average on standards over time.
- Each line represents a different standard that has been assigned to the class.
- Each point represents an assignment with that standard.
- Hover over a point to view the standard, assignment, and class average for that assignment.
Below the graph is a list of standards that have been assigned to the class. Select a standard to remove it from the graph.
Filter Toolbox
Use the Filter Toolbox to customize the Standards Report.
- Anonymize: Anonymize student names.
- Groups: Filter by student groups you have created. See Student Groups for more information.
- Date: Filter by date. The default is the current school year. If terms have been created, the default is the term that includes the present date.
- Standards: Select one or more standards to include in the report.
- Performance: Filter by the following performance levels:
- Equal to or greater than 80%
- 60–79%
- Less than 60%
- Triple dots (⫶): Download a CSV of the data in the table.
Select Reset Filters to remove all filters except the Date filter.
Standards Report Table
The Standards Report Table shows each student’s name, average score, and average score for each individual standard.
- Select a standard to open the Class Report for that standard.
- Select a student’s name to open the Student Progress Report.
Didn't Find What You Were Looking For?
.avif)
Charitable Number: 83-4228740


