
The Class Report
The Class Report
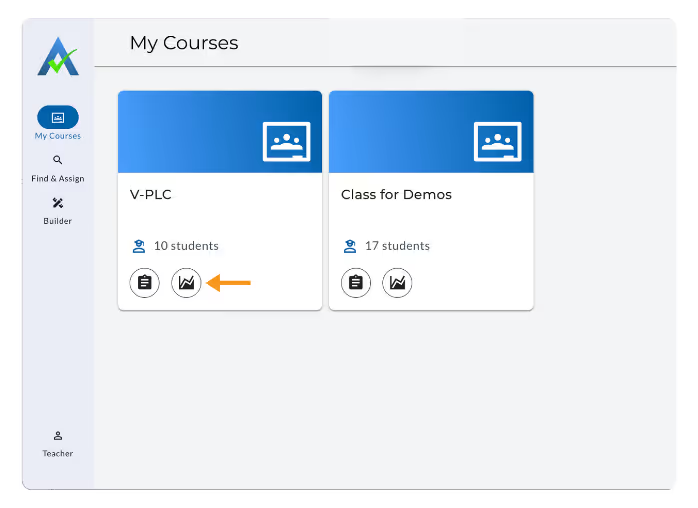
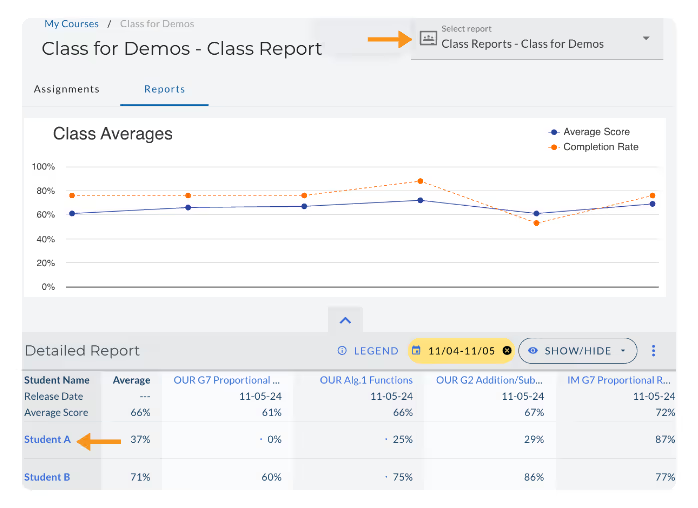
When you click the Report Icon from the My Courses homepage, you’ll be taken to the Class Report. This page shows student performance across all assignments in that class.
The Class Report gives you a snapshot of how your students are doing across all assignments. You’ll see:
- Class Averages Graph – a line graph displaying the average scores in blue and completion rates in orange, for each assignment.
- Detailed Report – A breakdown of student performance across all assignments.
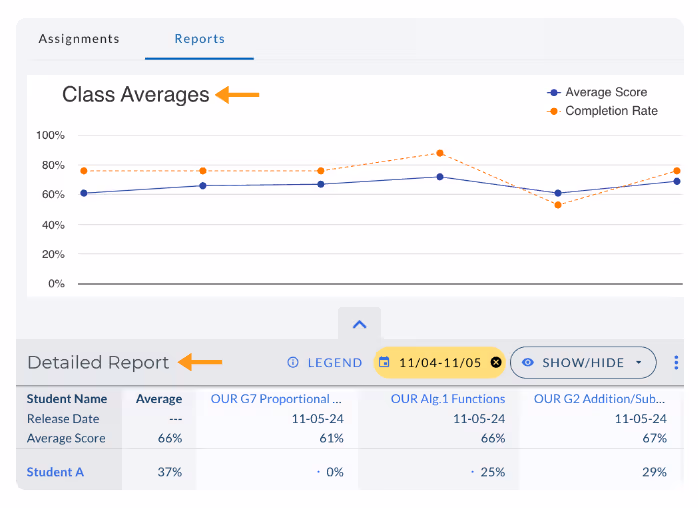
Detailed Report
A breakdown of student performance across all assignments.
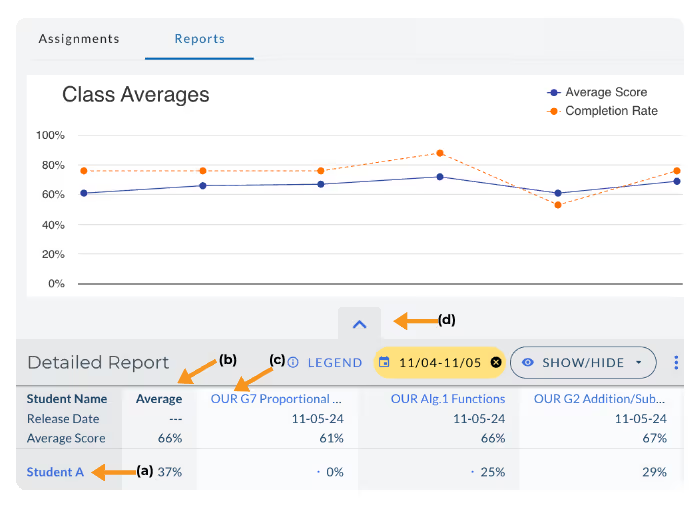
- Each row in the Detailed Report represents data for an individual student within the class. Clicking on the Student Name for any given class on the Reports Page will take you to the Student Progress Report.
- The Average column shows each student's average score across all assignments in the class.
- To the right of the Average column are the Individual Assignment columns. Each Assignment Column header includes the date the assignment was assigned and the average score across all students on the assignment. Below the header are each student’s average score on that assignment. Click any assignment header to access the Assignment Report data for that assignment.
- Click the ‘up’ arrow symbol if you would like to hide the Class Averages Graph and display only the Detailed Report.
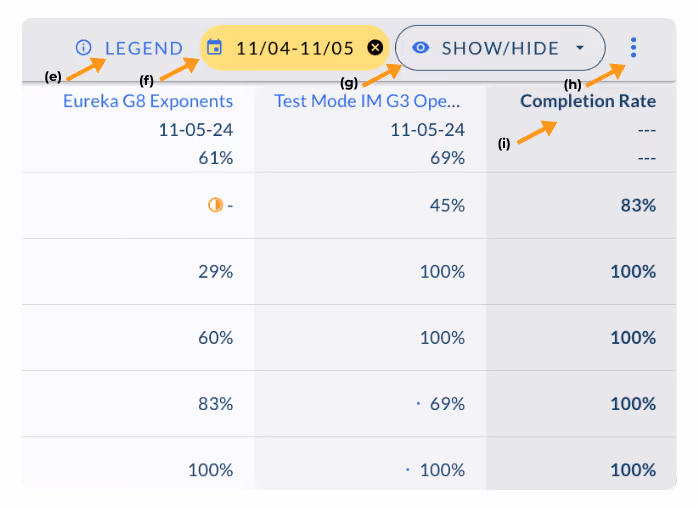
- The Legend shows what each symbol means within the Detailed Report.
- The Date Filter allows teachers to view Detailed Report data within a chosen date range.
- The Show/Hide Dropdown Menu enables teachers to choose which information to display or hide in the Detailed Report.
- The Triple Dot allows teachers to download the Detailed Report as a .csv file.
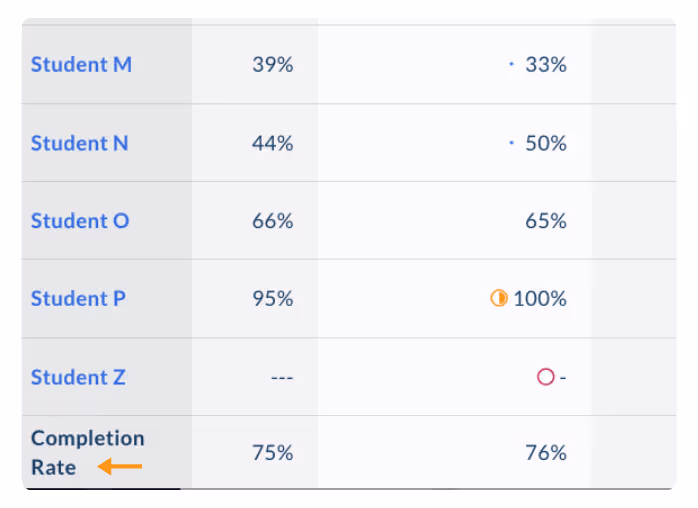
- The Completion Rate column shows the average completion rate for each student across the assignments displayed.
The bottom row of the Detailed Report shows Class Average Completion rates for each assignment as well as the Average Completion rate for all class assignments.
*Note: Skillbuilders are currently not included in the Class report.
Student Progress Report
You can view an individual Student Report in two ways from the Class Report:
- Select a student’s name from the Detailed Report section of a Class Report.
- Use the dropdown to choose the individual student for whom you’d like to see data.
Learn more about the Student Progress Report here.
The Class Report
When you click the Report Icon from the My Courses homepage, you’ll be taken to the Class Report. This page shows student performance across all assignments in that class.
The Class Report gives you a snapshot of how your students are doing across all assignments. You’ll see:
- Class Averages Graph – a line graph displaying the average scores in blue and completion rates in orange, for each assignment.
- Detailed Report – A breakdown of student performance across all assignments.
Detailed Report
A breakdown of student performance across all assignments.
- Each row in the Detailed Report represents data for an individual student within the class. Clicking on the Student Name for any given class on the Reports Page will take you to the Student Progress Report.
- The Average column shows each student's average score across all assignments in the class.
- To the right of the Average column are the Individual Assignment columns. Each Assignment Column header includes the date the assignment was assigned and the average score across all students on the assignment. Below the header are each student’s average score on that assignment. Click any assignment header to access the Assignment Report data for that assignment.
- Click the ‘up’ arrow symbol if you would like to hide the Class Averages Graph and display only the Detailed Report.
- The Legend shows what each symbol means within the Detailed Report.
- The Date Filter allows teachers to view Detailed Report data within a chosen date range.
- The Show/Hide Dropdown Menu enables teachers to choose which information to display or hide in the Detailed Report.
- The Triple Dot allows teachers to download the Detailed Report as a .csv file.
- The Completion Rate column shows the average completion rate for each student across the assignments displayed.
The bottom row of the Detailed Report shows Class Average Completion rates for each assignment as well as the Average Completion rate for all class assignments.
*Note: Skillbuilders are currently not included in the Class report.
Student Progress Report
You can view an individual Student Report in two ways from the Class Report:
- Select a student’s name from the Detailed Report section of a Class Report.
- Use the dropdown to choose the individual student for whom you’d like to see data.
Learn more about the Student Progress Report here.
Didn't Find What You Were Looking For?
.avif)
Charitable Number: 83-4228740