
The Student Progress Report
The Student Progress Report
The Student Progress Report allows teachers to see a detailed view of an individual student’s performance across assignments.
Accessing the Student Report
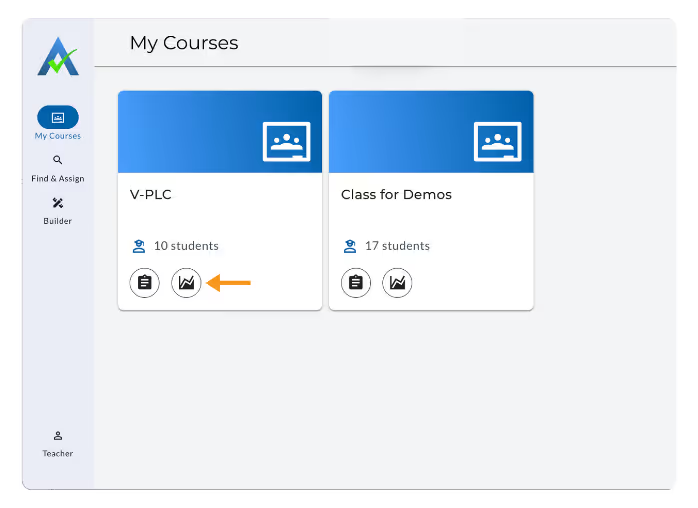
- From the My Courses homepage, click the Report Icon on a Class Card.
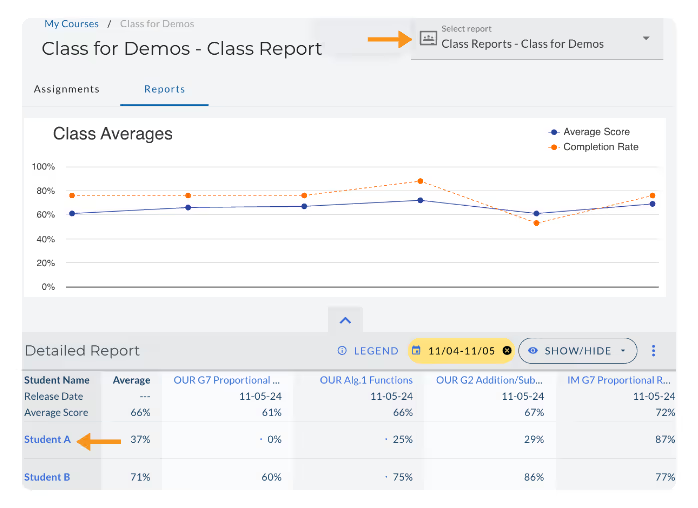
- Inside the Class Report, click any student’s name in the Detailed Report, or you can also use the dropdown to jump directly to a student.
Components of the Student Progress Report
The Student Progress Report shows trends and details for a single student compared to their class.
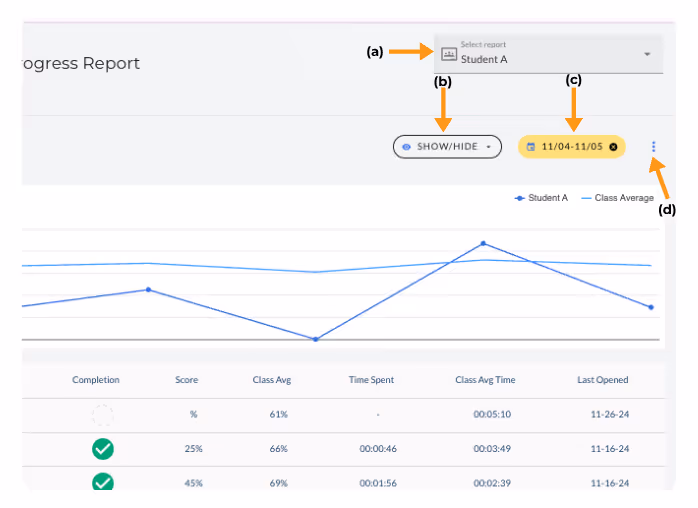
- Use the dropdown to choose the individual student for whom you’d like to see data.
- The Show/Hide Menu enables teachers to choose which information to display or hide in the Student Progress Report.
- The Date Filter allows teachers to view the Student Progress Report data within a chosen date range. Note: the default range is the current week
- The Triple Dot allows teachers to download the Student Progress Report as a .csv file.
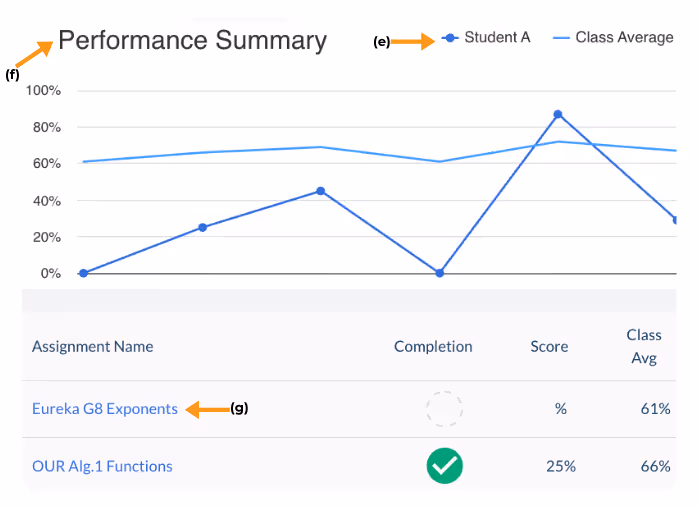
- Click on the line labels in the top right corner of the Performance Summary graph to add and remove specific lines on the graph.
- The Performance Summary graph shows the change in student average scores across each assignment over time compared to the class average scores. Hover over any dot to see the name of the assignment shown.
- Clicking on an individual assignment name will take teachers to the Student Details Report for the student on this assignment.
Type of data shown in the Student Progress Report:
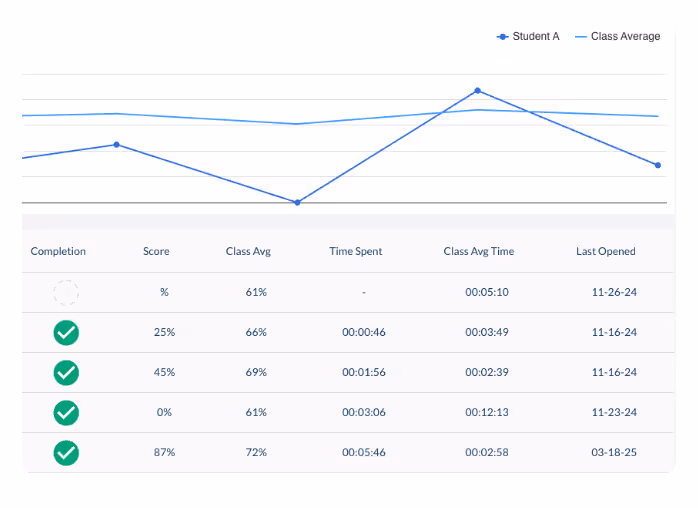
- Completion: shows the percentage of problems the student has completed on each assignment. A green check indicates that the assignment is completed.
- Score: shows the student’s score on each assignment.
- Class Average: shows the class average score on each assignment.
- Time Spent: shows the total amount of time the student spent completing each assignment.
- Class Avg Time: Shows the average amount of time students in the class spent completing each assignment.
- Last Opened: Shows the last date that the student opened each assignment.
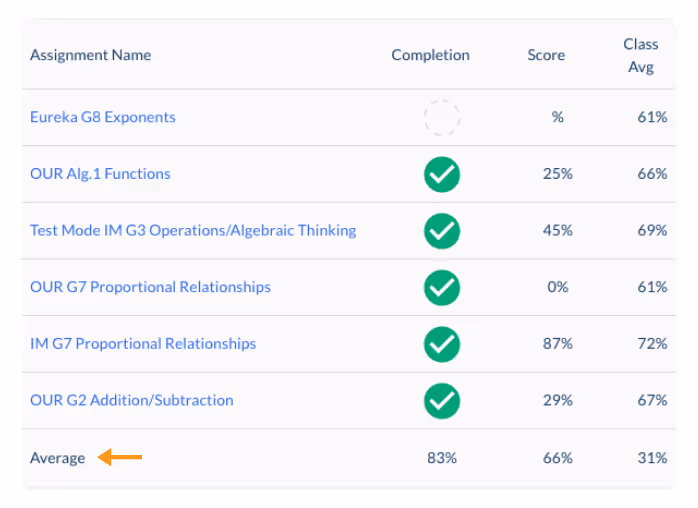
The Average row at the bottom of the Student Progress Report shows class averages across all assignments within the data range for each of the types of data listed above.
Note: Skill Builders is not part of the Student Progress Report. Learn more about the Skill Builders Report here.
The Student Progress Report
The Student Progress Report allows teachers to see a detailed view of an individual student’s performance across assignments.
Accessing the Student Report
- From the My Courses homepage, click the Report Icon on a Class Card.
- Inside the Class Report, click any student’s name in the Detailed Report, or you can also use the dropdown to jump directly to a student.
Components of the Student Progress Report
The Student Progress Report shows trends and details for a single student compared to their class.
- Use the dropdown to choose the individual student for whom you’d like to see data.
- The Show/Hide Menu enables teachers to choose which information to display or hide in the Student Progress Report.
- The Date Filter allows teachers to view the Student Progress Report data within a chosen date range. Note: the default range is the current week
- The Triple Dot allows teachers to download the Student Progress Report as a .csv file.
- Click on the line labels in the top right corner of the Performance Summary graph to add and remove specific lines on the graph.
- The Performance Summary graph shows the change in student average scores across each assignment over time compared to the class average scores. Hover over any dot to see the name of the assignment shown.
- Clicking on an individual assignment name will take teachers to the Student Details Report for the student on this assignment.
Type of data shown in the Student Progress Report:
- Completion: shows the percentage of problems the student has completed on each assignment. A green check indicates that the assignment is completed.
- Score: shows the student’s score on each assignment.
- Class Average: shows the class average score on each assignment.
- Time Spent: shows the total amount of time the student spent completing each assignment.
- Class Avg Time: Shows the average amount of time students in the class spent completing each assignment.
- Last Opened: Shows the last date that the student opened each assignment.
The Average row at the bottom of the Student Progress Report shows class averages across all assignments within the data range for each of the types of data listed above.
Note: Skill Builders is not part of the Student Progress Report. Learn more about the Skill Builders Report here.
Didn't Find What You Were Looking For?
.avif)
Charitable Number: 83-4228740