

Quick Insights
Quick Insights
Quick Insights provides teachers with an at-a-glance view of assignment data. Teachers can review assignment completion and performance, identify students who may need additional support, and explore performance by problem or standard.
Accessing Quick Insights
- From the Assignment List, select an assignment. The Quick Insights tab opens automatically.
%20(1).gif)
Understanding Quick Insights
The Quick Insights tab includes widgets that provide different views of assignment completion and student performance.
Performance Summary
The Performance Summary displays student performance for each problem using bar graphs.
Teachers can view performance as three individual bar graphs per problem or as a stacked bar graph.
Use the Filter to sort by Correct, Eventually Correct, and Incorrect.
.gif)
Class Average
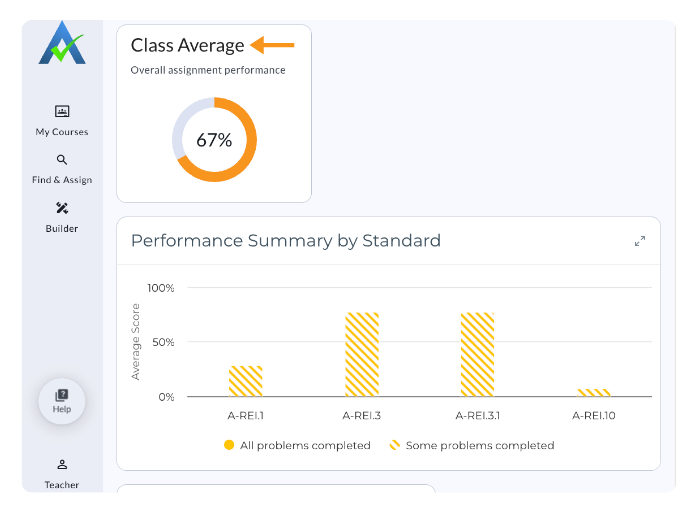
The Class Average displays the overall class average on the assignment.
Performance Summary by Standard
The Performance Summary by Standard displays the average percent score for each standard and indicates whether students have completed all or some of the problems.
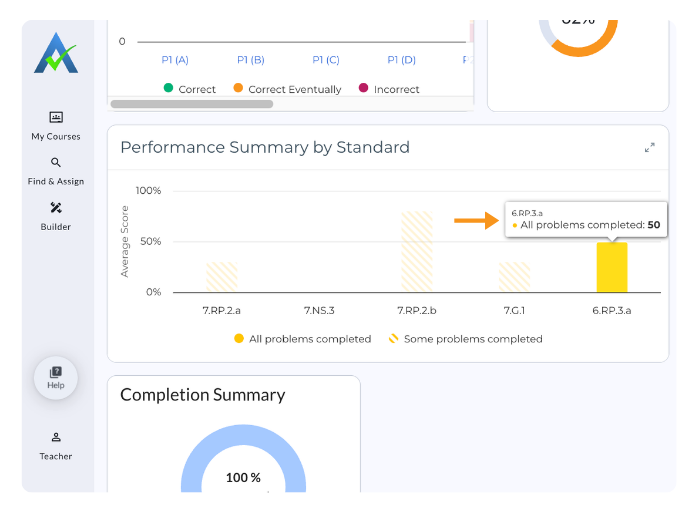
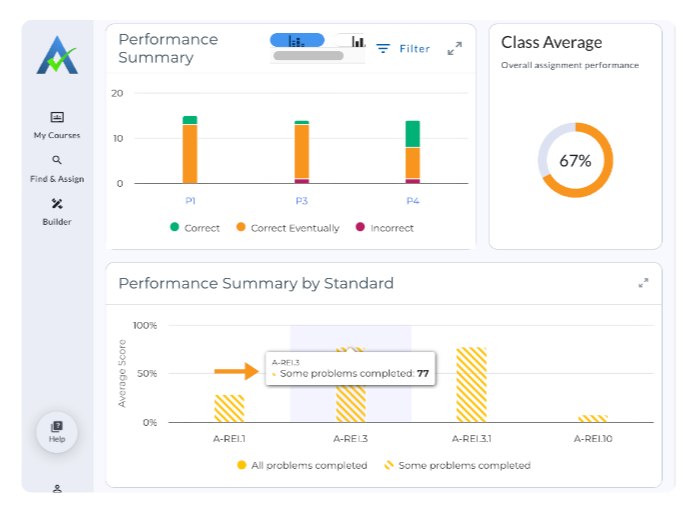
Hover over a standard to view the average percent score for that standard.
Completion Summary
The Completion Summary provides a visual overview of class completion, including the number of students who have completed the assignment.
.gif)
Student Clusters
Student Clusters groups students based on their performance on the assignment:
- High Performers: 80% or above
- Mid-Range Performers: 60%–70%
- Students Needing Support: Below 60%
Select + Group to create a Student Group from a cluster. This opens View and Edit Student Groups, where you can create or update the Student Group.
.gif)
ASSISTments Plus Users
Learn how AI-generated insights can help identify Key Trends, Students to Note, and Learning Gaps in the Quick Insights Plus User Guide.
Quick Insights
Quick Insights provides teachers with an at-a-glance view of assignment data. Teachers can review assignment completion and performance, identify students who may need additional support, and explore performance by problem or standard.
Accessing Quick Insights
- From the Assignment List, select an assignment. The Quick Insights tab opens automatically.
Understanding Quick Insights
The Quick Insights tab includes widgets that provide different views of assignment completion and student performance.
Performance Summary
The Performance Summary displays student performance for each problem using bar graphs.
Teachers can view performance as three individual bar graphs per problem or as a stacked bar graph.
Use the Filter to sort by Correct, Eventually Correct, and Incorrect.
Class Average
The Class Average displays the overall class average on the assignment.
Performance Summary by Standard
The Performance Summary by Standard displays the average percent score for each standard and indicates whether students have completed all or some of the problems.
Hover over a standard to view the average percent score for that standard.
Completion Summary
The Completion Summary provides a visual overview of class completion, including the number of students who have completed the assignment.
Student Clusters
Student Clusters groups students based on their performance on the assignment:
- High Performers: 80% or above
- Mid-Range Performers: 60%–70%
- Students Needing Support: Below 60%
Select + Group to create a Student Group from a cluster. This opens View and Edit Student Groups, where you can create or update the Student Group.
ASSISTments Plus Users
Learn how AI-generated insights can help identify Key Trends, Students to Note, and Learning Gaps in the Quick Insights Plus User Guide.
Didn't Find What You Were Looking For?
.avif)
Charitable Number: 83-4228740


