Problem Set "AP STATS REVIEW ASSIGNMENT #10" id:[PSABTYV]
| 1) Problem #PRAJQUU "PRAJQUU - 251365 - There is a datase..." |
|
There is a dataset of {20, 23, 25, 27, 29, 32}. If the number 100 is added into the dataset then the: © STATS4STEM.ORG |
|
| 2) Problem #PRAKK76 "PRAKK76 - 277663 - A homeowner just ..." |
A)
A homeowner just installed a new fireplace in his house and had a cord of wood (128 ft3) delivered from a local tree farm. For each cord of wood, the farm advertised the following percentages for each wood type:
When the homeowner received his 1 cord shipment of wood, he organized the wood and recorded how many cubic feet (ft3) of wood he received for each wood type. The data is found below:
The homeowner felt as though the distribution didn't represent the advertised distribution. He went about using a little statistics to prove that the company's advertisement is false. Which of the follow statistical tests would be most appriate in this situation? © STATS4STEM.ORG |
|
|
B)
Define the null and alternative hypothesis. A) Ho: There is no association between wood type and amount of wood received Ha: There is an association between wood type and amount of wood received B) Ho: There is an association between wood type and amount of wood received Ha: There is no association between wood type and amount of wood received C) Ho: The distribution of wood delivered equals the advertised distribution Ha: The distribution of wood delivered does not equal the advertised distribution D) Ho: The distribution of wood delivered does not equal the advertised distribution Ha: The distribution of wood delivered equals the advertised distribution |
|
|
C)
What is the expected count for the apple wood type? Round answer to the nearest hundredth. |
|
D)
What is the expected count for the Hemlock wood type? Round answer to the nearest hundredth. |
|
E)
What condition or conditions need to be checked before proceeding with the hypothesis test? Click all that apply. |
|
|
F)
Are all conditions met? |
|
|
G)
What is the degrees of freedom for this problem? |
|
H)
In order for one to reject the null hypothesis, using a significance level of 0.05, the chi-squared test statistic must found to be _________________ than _________________? Link to Χ2 table. The most appropriate answers for the blanks above are: |
|
|
I)
What is the chi-squared test statistic? Round answer to the nearest hundredth. |
|
J)
Using either the TI-83 or R/Rweb, calculate the p-value. Round answer to the nearest hundredth.
|
|
K)
Assume that the significance level is 0.05, the homeowner's best conclusion would be: A) I calculated a p-value of 0.77, which is greater than the stated significance level of 0.05. Therefore, we reject the null hypothesis. The data supports the claim that the distribution of wood delivered does not equal the advertised distribution. B) I calculated a p-value of 0.77, which is greater than the stated significance level of 0.05. Therefore, we can fail to reject the null hypothesis. C) I calculated a p-value of 0.77, which is greater than the stated significance level of 0.05. Therefore, we can reject the null hypothesis. D) I calculated a p-value of 0.77, which is greater than the stated significance level of 0.05. Therefore, we fail to reject the null hypothesis. The data fails to supports the claim that the distribution of wood delivered does not equal the advertised distribution. E) I calculated a p-value of 0.77, which is less than the stated significance level of 0.05. Therefore, we fail to reject the null hypothesis. The data proves that the distribution of wood delivered is equal the advertised distribution. F) I calculated a p-value of 0.77, which is greater than the stated significance level of 0.05. Therefore, we reject the null hypothesis. The data supports the claim that the distribution of wood delivered does not equal the advertised distribution. |
|
| 3) Problem #PRAJQPV "PRAJQPV - 251211 - A) The histogram ..." |
A)
A) The histogram below was created from the variable thickness from the geophones dataset. Which of the following is correct? © STATS4STEM.ORG |
|
B)
B) Which of the following boxplots most likely represents the distribution of the variable thickness found in part A?    |
|
|
C)
C) If repeated samples of size 100 are drawn from the distribution found in part A, and the sample mean was calculated for each sample, the distribution for the sample means would be: |
|
|
D)
Even if the distribution for a given population is non-normal, the sampling distribution of sample means will be approximately normal due to the: |
|
|
E)
E) The mean of the thickness variable is 269.4 and the standard deviation is 10.4. If repeated samples of size 100 are taken from the thickness data, the sampling distribution of sample means would have which distribution? |
|
| 4) Problem #PRAJBZH "PRAJBZH - 239978 - Toyota found that..." |
|
A)
Toyota found that 47% of their brakes had problems from their new production of 1.5 million cars. They decided to test 95 of their products to see if they will have brake failure. What is the probability that 56 will have brake failure. Round answer to the nearest hundredth. © STATS4STEM.ORG |
|
B)
Find the probability that less than 38 or more than 52 cars will have a brake failure. Round answer to the nearest hundredth. |
| 5) Problem #PRAKM5E "PRAKM5E - 278539 - An adult patient ..." |
|
An adult patient visits a doctor complaining of a persistent headache that he has had for months. The doctor, while filling out the prescription, mistakenly prescribes a very weak form of medicine usually prescribed to newborns. It can be assumed that this medication will have no effect on the adult patient. However, a week passes and the patient approaches the doctor while walking down the street. The patient thanks the doctor for curing his headache. This is an example of: © STATS4STEM.ORG |
|
| 6) Problem #PRAKM5F "PRAKM5F - 278540 - A paper published..." |
|
A paper published by the Brain Injury Research Institute reported: 1) Over 60 percent of NFL athletes have sustained at least one concussion and approximately one-quarter has had three. 2) In the NFL, retired athletes have a 37 percent higher risk of being diagnosed with Alzheimer’s Disease than men in the general population. An article published in the New York Times reports: 3) Michigan researchers conducted a phone survey in late 2008 in which 1,063 retired players — those who participated from an original random list of 1,625 — were asked questions on a variety of health topics. Players had to have played at least three or four seasons to qualify. Questions were derived from the standard National Health Interview Survey so rates could be compared with those previously collected from the general population, the report said. The Michigan researchers found that 6.1 percent of players age 50 and above reported that they had received a dementia-related diagnosis, five times higher than the cited national average, 1.2 percent. Players ages 30 through 49 showed a rate of 1.9 percent, or 19 times that of the national average, 0.1 percent. Based on these facts, one can claim: A) Concussions cause Alzheimer's Disease. B) There appears to be a relationship between concussions and Alzheimer's Disease and a randomized controlled experiment is the most appropriate method to show causation between the concussions and Alzheimer's Disease. C) There appears to be a relationship between concussions and Alzheimer's Disease and a randomized controlled experiment is needed to show causation between the concussions and Alzheimer's Disease. However, a randomized controlled experiment would most likely never occur due to ethical reasons. D) While experiments are typically required to prove causation, the facts presented overwhelmingly support the claim that concussions cause Alzheimer's Disease. Thus, and experiment is not needed in this specific case. © STATS4STEM.ORG |
|
| 7) Problem #PRAJBWH "PRAJBWH - 237897 - #1" |
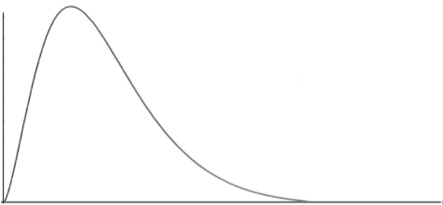 The distribution above can be labeled as: © STATS4STEM.ORG |
|
| 8) Problem #PRAJQUV "PRAJQUV - Prob 1" |
|
Suppose you are drawing chips from a bag. There are 5 red chips, 6 black chips, 3 blue chips, and 4 green chips. What is the probability of drawing a red or a green chip? © STATS4STEM.ORG |
| 9) Problem #PRAKFFQ "PRAKFFQ - 273092 - The blue ..." |
A)
 The blue dot in Plot B can be considered a(n): © STATS4STEM.ORG |
|
B)
 The blue dot in Plot B can be considered a(n): |
|
| 10) Problem #PRAKEVH "PRAKEVH - 272528 - Here are the coun..." |
A)
Here are the counts of employees in an office, classified by gender and eye color:
Round all answers to the nearest hundredth. a) What is the probability that an employee chosen at random has hazel eyes? Round answer to the nearest hundredth. © STATS4STEM.ORG |
|
B)
b) What is the probability that you choose a male, given that they have green eyes? Round answer to the nearest hundredth. |
|
C)
c) What is the probability that you choose a person with brown eyes, given that they are female? Round answer to the nearest hundredth. |
|
D)
d) What is the probability that you choose a female with green eyes? Round answer to the nearest hundredth. |
|
E)
e) What is the probability that you choose a male with brown eyes? Round answer to the nearest hundredth. |