| 1) Problem #PRAD8UM "PRAD8UM - 117779 - The R Project is..." |
 The R Project is a free software program for use in statistical computing and graphics. It is used by many professional and non-professional statisticians. This link leads to a helpful resource which explains many aspects of R: cran.r-project.org/doc/contrib/Verzani-SimpleR.pdf To start out, let's make a data set. Say a statistics class has ten students and their scores on an exam are as follows: 67, 99, 81, 83, 77, 84, 21, 59, 67, and 91. To create a data set from these numbers in R, type: x=c(67,99,81,83,77,84,21,59,67,91) Next, find the median (M) and mean (X-bar) of these data by typing: mean(x) median(x) Now press "Run the R Program" and scroll down to check the answers. The median and mean are? n.b. You can replace the "x" with "data" or "testscores" or anything else which you would like to name the data. Just make sure to use this same name consistently (if you define the data as "testscores" and then ask R what the mean of "x" is, R will not give you the correct answer). |
Multiple Choice:
|


|
Hints: |
|
|
|
|
| 2) Problem #PRAD8XM "PRAD8XM - 117872 - A study was taken..." |
|
A study was taken of twenty high school students and how many times they eat fast food a week, and the results were as follow: 3,1,0,7,2,2,5,0,1,4,6,5,2,3,4,7,0,1,0,0. Enter the data into R What is the median number of times a week? What is the mean number of times a week? |
Multiple Choice:
|
| 3) Problem #PRAD9EG "PRAD9EG - 118333 - Playing with the ..." |
|
Playing with the Stock Market Stock markets are a matter of international attention. Massive amounts of money are lost and gained each day, as stock traders decide the value of a stock, and players of the stock market make gambles about these values. Our goal here isn't to get rich quick by making bets on the market, rather we have academic desires--to learn some R commands using data from the stock market. 1.) Starting in with R The R software can perform in a convenient way most of the calculations in statistics. Think of R as a calculator for statistics where the many dedicated buttons are replaced by a keyboard where you type the commands for what you want to do. Link: http://rss.acs.unt.edu/cgi-bin/R/Rprog Starting R in Windows opens up a large window that will contain various subwindows: a command console for typing commands, windows for displaying graphs, data-editing windows, and help page windows. Interacting with R is done in a question-and-answer manner: you ask questions and R answers. You ask these questions by typing them in after the prompt: > For example, to see that R can be a calculator, type the following commands (not the prompt) and hit the Enter key: > 2 + 2 [1] 4 > 5 * 6 [1] 30 > (3 + 2)^2 [1] 25 After a leading [1], R returns the correct answer. (The leading [1] will be explained later.) As you see, R uses +, -, *, /, and ^ for the usual math notations; and parentheses to group expressions. Use R to find the value for: |

Algebraic Expression:
|
|
Hints: |
|
|
| 4) Problem #PRAD9FR "PRAD9FR - 118372 - 2.) Working with ..." |
|
2.) Working with data Statistics is about analyzing data sets which likely will have more than one data point. Unlike most calculators, R works naturally with data sets. The price of a share of stock fluctuates on a daily basis. Some stocks more so than most. In January of 2004, The AT&T wireless stock (symbol AWE) for AT&T's cellphone services had been having a big decline. In late January though, word of a possible merger was released changing how investor's viewed the stock. (AT&T merged with Cingular in 2004.) Data for the closing price of AT&T wireless stock for a few different Fridays are in Table 1. What can we say about this data?
2.1- Storing data Before doing anything, let's store the data into the computer for January and December. We use the function c() to combine numbers into a data set. Simply separate the values with commas. > c(10.61, 9.99, 8.15, 8.08, 7.63, 7.35, 7.13, 7.27) [1] 10.61 9.99 8.15 8.08 7.63 7.35 7.13 7.27 The numbers were combined and then printed - then they were forgotten! Again, the [1] appears. This helps keep track of how many numbers are in the data vector (we call a variable that stores data a data vector). When there are several rows of numbers output, the number in square brackets indicates the position of the first number in that row. Functions in R are called using the function name, an opening parentheses, any arguments, and then a closing parentheses. Don't forget the parentheses. The output of a function is the name for what is returned. We need to store the data so we can reuse it. To do this, we assign the output to a variable using an equals sign. The following will store the values into the variable called awe. > awe = c(10.61, 9.99, 8.15, 8.08, 7.63, 7.35, 7.13, 7.27) R is quiet after an assignment; only the prompt is returned. However, R was busy. Wherever the variable awe is used, R will refer to this dataset. For example, to see the values of a variable simply type its name: > awe |
Algebraic Expression:
|
|
Hints: |
|
|
|
|
|
|
| 5) Problem #PRAD97R "PRAD97R - 119085 - Manipulating data..." |
|
Manipulating data using functions In R data sets are explored, summarized, and analyzed by applying functions to the data sets. A basic usage looks like functionname( datasetname ) Though, many functions will have extra arguments to change their default behavior. Many things can be done with the output of a function. It may simply answer your question. Or you may want to store it for later usage, or you may compose it directly with another function. For the stock market, where there is so much data available, people are interested in summaries of the data. For example, maximum price, minimum price, and average price. R has functions max() and min() to find the maximum and minimum values in a data vector. > max(awe) [1] 10.61 > min(awe) [1] 7.13 These are returned together with the range() function. > range(awe) [1] 7.13 10.61 |
Multiple Choice:
|
|
Hints: |
|
|
|
|
| 6) Problem #PRAD972 "PRAD972 - 119094 - Second part of 3 ..." |
|
Second part of 3 The difference between the maximum and minimum values in a data set is sometimes referred to as the range of the data sets. There are several ways to find this. We can subtract the minimum from the maximum, or use the diff() function on the output of range(). For example, > diff(range(awe)) [1] 3.48 Find the difference between the maximum and minimum values of the variables sbux and pcs. The average value of a data set can be found several ways, as illustrated next. For the data in awe we can do it all by hand: > (10.61 + 9.99 + 8.15 + 8.08 + 7.63 + 7.35 + 7.13 + 7.27)/8 [1] 8.27625 But, why should we type the data values in when they are already stored into awe. We can let the computer do the addition using the sum() function: > sum(awe)/8 [1] 8.27625 As well, rather than counting the eight numbers we added, we can let the computer find the length using length(awe)): > sum(awe)/length(awe) [1] 8.27625 This works fine, but as find the average is a common task in statistics there is a built-in function, mean(), for this (the sample mean is the name of the average of a data set in statistics) > mean(awe) [1] 8.27625 |
Multiple Choice:
|
|
Hints: |
|
|
|
|
| 7) Problem #PRAD97Z "PRAD97Z - 119093 - Continuation of p..." |
|
Continuation of problem 3... The difference between the maximum and minimum values in a data set is sometimes referred to as the range of the data sets. There are several ways to find this. We can subtract the minimum from the maximum, or use the diff() function on the output of range(). For example, > max(awe) - min(awe) > diff(range(awe)) [1] 3.48 |
Multiple Choice:
|
|
Hints: |
|
|
| 8) Problem #PRAD98A "PRAD98A - 119102 - graphical views R..." |
|
graphical views R has several functions that produce graphics for viewing a data set. Enter the following into R: > plot(awe) After typing this command, a plot window should open up showing an admittedly boring plot. By default, this plots the numbers in the order they are typed in. The x-axis label, Index, refers to the position in the data vector of the data point. Seems like the stock price is dropping doesn't it? Well not really, that's because the stock numbers were typed in reverse chronological order. How can we reverse the numbers without retyping the data? R has a built in function rev() to do so: Question:
Make a reverse plot of the sbux data set. Are the reversed data positively correlated or negatively? |
Multiple Choice:
|
| 9) Problem #PRAD97X "PRAD97X - 119091 - 4.) Real data set..." |
|
4.) Real data sets All of the previous computer work could have been done by hand or with a calculator. To illustrate why a computer is a much better tool for statistics than a calculator, let's use bigger datasets. So big, you wouldn't even want to find the largest number by hand, let alone the average value. Rather than type the data in, we are going to let the computer do the work for us. However, you need to teach the computer how by typing the following exactly as shown (there are four capital letters): > source("http://www.math.csi.cuny.edu/st/R/downloadStockData.R") This command downloads a file from the Stem and Tendril website. The file defines a new function, downloadStockData(), that will fetch the previous years worth of data on a stock courtesy of http://finance.yahoo.com. It only requires the user to provide the stock symbol. To illustrate, a years worth of stock data for for Yahoo! for can be retrieved by using its symbol, "YHOO." > yahoo = downloadStockData("YHOO") > max(yahoo) [1] 57.59 This shows the maximum closing value of the stock for the previous year at the time this project was made (October 26, 2010). A plot (Figure 3) of the year's activities is produced as before: > plot(yahoo) From this graph we can see a lot about the history of the stock. For example, We can look at this graph and see that the minimum value occurred near 130 and the maximum value occurred near index 50. Download current stock data for Yahoo!. Answer the following: What was the maximum price? minimum price? average price?  |
|
Ungraded Open Response: |
| 10) Problem #PRAD979 "PRAD979 - 119101 - The day-to-day di..." |
|
The day-to-day differences in the stock price can be looked at by using the function diff(). This will form a new data vector containing the differences between successive days values. For example, the command > yahoo.diffs = diff(yahoo) forms the differences and stores them into the data vector yahoo.diffs. For yahoo.diffs do the following: What was the largest increase in a given day? the largest decrease in a given day? |
|
Ungraded Open Response: |
|
Hints: |
|
|
|
|
|
|
| 11) Problem #PRAECWE "PRAECWE - 121679 - 5.) Using indices..." |
|
5.) Using indices The entries in a data vector come with a natural order: the first, second, ..., nth. Being able to access the values by their index can extend the ways we can look at a data vector. To access a single value in a data set can be done using square brackets, []. For example, if the closing value of the Dow Jones Industrial Average for a week was 10196 10243 10391 10433 10368 We can use indexing to subtract the week's first value from the last > dow = c(10196, 10243, 10391, 10433, 10368) > dow[5] - dow[1] [1] 172 This says the market went up 172 points during this week. (Note that you use square brackets for data extraction, and parentheses for functions.) More than one index can be referred to at once. To pull out the first and fifth days is done with: > dow[c(1, 5)] [1] 10196 10368 Question 14: Copy the following data set into R: >dow=c(55,60,65,70,71,90,65,78,76,88,55,67,35,56,45,76,85,87,56,87,56,46,76,45,56,75,66,77,56,55,45,45,64,75) How many data points are there in the set (do not count manually)? What was the overall difference between the first and last point (do not calculate by hand)? Give in answer , answer form. |
Algebraic Expression:
|
|
Hints: |
|
|
|
|
|
|
|
|
|
|
| 12) Problem #PRAECX4 "PRAECX4 - 121731 - 5.1) Indices can ..." |
|
5.1) Indices can also be logical expressions allowing one to question the data. We use this data for dow. > dow [1] 10196 10243 10391 10433 10368 We can ask what days were more than 10,200 as follows > dow > 10200 [1] FALSE TRUE TRUE TRUE TRUE The answer is TRUE or FALSE for each value in the data vector dow. When using such answers as indices, the values corresponding to TRUE are returned. > dow[dow > 10200] [1] 10243 10391 10433 10368 Logical expressions used for indices must be the same length as the data vector. Other logical questions are possible using >, >=, <, <=, == (double equals signs), and ! for the negative. Expressions can be combined using & (and) and | (or). For example, values less than or equal to 10,400 are > dow[dow <= 10400] [1] 10196 10243 10391 10368 Both conditions are found with > dow[dow <= 10400 & dow > 10200] |
Multiple Choice:
|
|
Hints: |
|
|
|
|
|
|
| 13) Problem #PRAECWH "PRAECWH - 121682 - 5.2) What index w..." |
|
5.2) What index was that? A natural question to ask is what index has a value that does something special. For example, when is something at its maximum, or minimum? The which() command can answer in terms of the index. > which(dow == max(dow)) [1] 4 The answer are the indices where the data set dow is at a maximum value. Similarly, the indices of when dow is at its minimum would be found with: > which(dow == min(dow)) [1] For our data set, which data point is the minimum, and which is the maximum? |
Multiple Choice:
|
|
Hints: |
|
|
| 14) Problem #PRAECYG "PRAECYG - 121743 - R Cheat Sheet Cr..." |
R Cheat Sheet
Minimum: min(x) Range: range(x) Sum: sum(x) Mean: mean(x) Median: median(x) Standard deviation: sd(x) Variance: var(x) Correlation: cor(x,y) Quantile (Q1, Q2, Q3, Q4): quantile(x) Round x to n decimal places: round(x,n) Histogram: hist(x) Barplot: barplot(x) Stemplot: stem(x) Pie chart: pie(x) Boxplot: boxplot(x,y) Plot: plot(x) plot(x,y) Question: A survey of fifteen students was taken asking how many hours do they spend on facebook daily. The results were as followed: 4,2,1,0,2,0,3,2,2,5,3,2,6,1, and 2. Using this R cheat sheet, make a boxplot, and then find the minimum, maximum, mean, median, and quantiles. |
Multiple Choice:
|
|
Hints: |
|
|
|
|
| 15) Problem #PRAEAA7 "PRAEAA7 - 119192 - What is extrapola..." |
|
What is extrapolation? |
Multiple Choice:
|
| 16) Problem #PRAECX9 "PRAECX9 - 121736 - x (third exam ..." |
|
Algebraic Expression:
|
|
Hints: |
|
|
|
|
|
|
Scaffold:
|
Scaffold:
|
Scaffold:
|
| 17) Problem #PRAECYM "PRAECYM - 121747 - Refer to the data..." |
|
Refer to the data in this link to solve the problem http://cnx.org/content/m17090/latest/. What would you predict the final score to be for a student who scored 66 on the third exam. Round answer to the nearest hundredth. |
Multiple Choice:
|
|
Hints: |
|
|
| 18) Problem #PRAECYQ "PRAECYQ - 121750 - Refer to the data..." |
|
Refer to the data in this link to solve the problem http://cnx.org/content/m17090/latest/. What would you predict the final exam score to be for a student who scored a 80 on the third exam? |
Multiple Choice:
|
| 19) Problem #PRAEDFW "PRAEDFW - 122221 - The data below wa..." |
The data below was obtained from Centers of Disease Control and Prevention.
The data shows the number of reported cases of HIV/AIDS in infants born to HIV-infected mothers from 1994 to 2004. Plot the points to find the least-squares regression line. Round to the nearest hundredth. |
Algebraic Expression:
|
|
Hints: |
|
|
|
|
|
|
| 20) Problem #PRAEDF4 "PRAEDF4 - 122227 - Refer to the dat..." |
|
Refer to the data in the previous question. What would you predict the number of cases to be for a student in the year 2000? Round answer to the nearest hundredth. |
Multiple Choice:
|
| 21) Problem #PRAEDF7 "PRAEDF7 - 122230 - What would you pr..." |
|
A)
What would you predict the number of cases to be for a student in the year 2004? Round answer to the nearest whole number. |
Algebraic Expression:
|
|
Hints: |
|
|
|
|
|
B)
Outliers are points that are far from the least squares line and other observations. Outliers in the x direction often influence the least squared regression line. |
Multiple Choice:
|
| 22) Problem #PRAEDF9 "PRAEDF9 - 122232 - The data below wa..." |
Algebraic Expression:
|
|
Hints: |
|
|
|
|
| 23) Problem #PRAEDGA "PRAEDGA - 122233 - Which variable is..." |
|
Which variable is the explanatory value and which axis should this variable be located? |
Multiple Choice:
|
| 24) Problem #PRAEDGF "PRAEDGF - 122238 - What is the obser..." |
|
What is the observed value when the total cigarette value is 425? |
Algebraic Expression:
|
|
Hints: |
|
|
|
|
|
|
| 25) Problem #PRAEDKP "PRAEDKP - 122338 - Do outliers affec..." |
|
Do outliers affect the accuracy of a least squares regression line? |
Multiple Choice:
|
| 26) Problem #PRAEDKS "PRAEDKS - 122341 - Which of these is..." |
|
Which of these is most influenced by outliers? |
Multiple Choice:
|
|
Hints: |
|
|
| 27) Problem #PRAD9EK "PRAD9EK - Kristin Concannon & Dana Spencer, Section 11 - Problem 1" |
|
Use the following link that simulates a least-squares regression line: http://hadm.sph.sc.edu/COURSES/J716/demos/LeastSquares/LeastSquaresDemo.html Click on the buttons located on the right side of the page: "Show Residuals", "Show Squares", "Squares' Sum", "Residuals' Sum", and "LS Line". The least-squares regression line of y on x is the line that makes the sum of the squared vertical distances of the data points from the line as small as possible. Do you understand the function of a least-squares regression line? Samuel L. Baker, "Least Squares Applet," hspm.sph.sc.edu. July 21, 2002. http://hadm.sph.sc.edu/COURSES/J716/demos/LeastSquares/LeastSquaresDemo.html |
Multiple Choice:
|
| 28) Problem #PRAD9K3 "PRAD9K3 - Kristin Concannon & Dana Spencer, Section 11 - Problem 2" |
|
Which of the following is NOT a property of the LSR Line? source: student-made. |
Multiple Choice:
|
| 29) Problem #PRAD97J "PRAD97J - Kristin Concannon & Dana Spencer, Section 11 - Problem 3" |
|
A)
Let's start analyzing the correlation of regression by using R with the "women" data set. First, go ahead and create a scatterplot of the women data by typing in: women plot(women) Now we will find the correlation of the data. We can do that in R using the cor(x,y) function. Make sure you have the following typed into R: plot(women) x=(women$height) y=(women$weight) cor(x,y) What is the correlation of this data set? source: student-made |
Algebraic Expression:
|
|
Hints: |
|
|
|
|
|
B)
Now we can add in the least squares regression line on our scatterplot. Type in the following code into R: x=(women$height) y=(women$weight) plot(x,y) model=lm(y~x) ### This creates a linear model using the data from x and y abline(model) ### This function adds the line to your scatterplot Have you made a scatterplot with the least-squares regression line? |
Multiple Choice:
|
|
C)
Use the formulas below for the equation of a least squares regression line. Solve for the slope, b. y-hat = a + b*x where, b = r*(sd(y)/sd(x)) ### remember r is correlation, in R, r=cor(x,y). B equals? (Round to the nearest hundredth). |
Algebraic Expression:
|
Scaffold:
|
Scaffold:
|
Scaffold:
|
Scaffold:
|
|
D)
Let's solve for the y-intercept, a. The formula is: a=(y-bar) - b*(x-bar) What is the y-intercept of our least squares linear equation? (Round to the nearest hundredth). |
Algebraic Expression:
|
|
Hints: |
|
mean(women) |
|
|
|
E)
Finally, have R simply define the slope and y-intercept for us. Use the following code: model=lm(y~x) ### this will create a least squares model for our data set model ### this will output the slope and y-intercept for us What is the output? |
Multiple Choice:
|
| 30) Problem #PRAD97F "PRAD97F - Kristin Concannon & Dana Spencer, Section 11 - Problem 4" |
|
An ice cream truck owner collects data on the number of sales made each day and the average temperature that day. He computes a regression line for predicting the number of sales based on how far the daily temperature is from freezing (32 degrees Fahrenheit) and finds sales = 0.22 + 1.8 X (degrees over 32 Fahrenheit). Identify the y-intercept. source: No Author, "EBook Problems GLM Regress", WikiStatistics Book, January 8, 2009. http://wiki.stat.ucla.edu/socr/index.php/EBook_Problems_GLM_Regress |
Algebraic Expression:
|
|
Hints: |
|
|
|
Hints: |
|
|
| 31) Problem #PRAEBYN "PRAEBYN - Kristin Concannon & Dana Spencer, Section 11 - Problem 5" |
|
A)
Let's now use the cars data set to start us off with residual plots: Load the data set. We are going to use the function called attach, and also insert a least-squares regression line. ### Start Code cars names(cars) attach(cars) ### cars has two variables, speed & distance. This function ### allows us to simply call on the variable names without using the ### the complicated notation: cars$speed or cars$dist plot(speed, dist) model=lm(speed~dist) abline(model) model ### End Code Now, using the cars data set. Use the attach function to plot speed vs. distance. Make sure you don't use the $ anywhere in the code. Question: Do you understand the attach function, and the least squares-regression line? source: student-made. |
Multiple Choice:
|
|
B)
Now, create a residual plot to determine the fit of regression line. We also will create the scatterplot with least-squares regression line (LSRL) to better understand the the relationship between LSRL and the residual plot. Copy and paste the following code into R. ### Code plot(speed, dist) abline(model) residuals=model$residuals residuals ### now lets have R create a residual plot plot(speed, residuals, main="Residual Plot") abline(h=0) ### lets draw a horizontal line at 0 ### End Code What does the horizontal line at 0 on the residual plot represent? |
Multiple Choice:
|
|
Hints: |
|
|
|
|
|
C)
Lets see how well our LSRL fits our data. Do you see a pattern in the residual plot? |
Multiple Choice:
|
|
D)
Refering to the cars residual plot, do you feel that the linear model is most appropriate for this data set? |
Multiple Choice:
|
|
Hints: |
|
|
| 32) Problem #PRAEBYR "PRAEBYR - Kristin Concannon & Dana Spencer, Section 11 - Problem 6" |
Which Residual Plot represents the most accurate data set? image source: No Author, "Statistics and Probability Glossary," StatTrek, 2010, http://stattrek.com/Help/Glossary.aspx?Target=Residual%20plot |


Multiple Choice:
|
| 33) Problem #PRAEDAX "PRAEDAX - Kristin Concannon & Dana Spencer, Section 11 - Problem 7" |
|
A)
Let's see how outliers affect a data set and the regression line. Put random scatterplot data into R by pasting in the following code: x=c(3,5,7,9,11) y=c(5,8,9,14,18) plot(x,y) Now, add in the regression line: model=lm(y~x) abline(model) Does the data appear to have a very accurate regression line? source: student-made. |
Multiple Choice:
|
|
B)
Now, let's throw in an outlier. Copy this code into R: x=c(3,5,7,9,11,4) y=c(5,8,9,14,18,22) plot(x,y) model=lm(y~x) abline(model) Has the regression line stayed the same? |
Multiple Choice:
|
|
C)
In response to the above questions, outliers DO change the regression line equation. Type in model after the previous coding, and find out the equation for the new line. What is the equation? |
Multiple Choice:
|
| 34) Problem #PRAECYN "PRAECYN - Kristin Concannon & Dana Spencer, Section 11 - Problem 8" |
|
A)
An influential point is a point that affects the coefficient of the regression line. We will explore this using R, by making a scatterplot that includes an influential point. Open R, and put in the following code: x=c(1,2,3,4,5,6) y=c(5,7,8,14,18,19) plot(x,y) You should get a scatterplot that appears visibly linear. Now let's add in a regression line: model=lm(y~x) abline(model) To find the equation of the line, add in: model What is the equation of this linear regression line? source: student-made. |
Multiple Choice:
|
|
Hints: |
|
|
|
|
|
|
|
B)
Now, let's add in an influential point, by putting this data set into R: x=c(1,2,3,4,5,6,18) y=c(5,7,8,14,18,19,45) plot(x,y) The scatterplot should still appear to be linear. Now let's add in a regression line again: model=lm(y~x) abline(model) Find the equation of this regression line by using the model function a second time. |
Multiple Choice:
|
|
C)
Did the influential point change the equation of the regression line completely? |
Multiple Choice:
|
| 35) Problem #PRAD97P "PRAD97P - Kristin Concannon & Dana Spencer, Section 11 - Problem 9" |
|
Correlation is resistant or not resistant to a few outlying observations? source: student-made. |
Multiple Choice:
|
| 36) Problem #PRAEBXF "PRAEBXF - 120750 - What is true abou..." |
|
What is true about the Least-Squares Residual Line? |
Multiple Choice:
|
| 37) Problem #PRAEBXG "PRAEBXG - 120751 - If the correlatio..." |
|
If the correlation of a set of data is 0, what does this tell you about the data. |
Multiple Choice:
|
| 38) Problem #PRAEBXH "PRAEBXH - 120752 - Correlation measu..." |
|
Correlation measures: |
Multiple Choice:
|
Scaffold:
|
Scaffold:
|
Scaffold:
|
| 39) Problem #PRAEDPU "PRAEDPU - 122436 - True or False: An..." |
|
True or False: An influential point greatly affects the slope or the LSRL and always lowers the correlation coeffeicient. |
Multiple Choice:
|
Scaffold:
|
Scaffold:
|
Scaffold:
|
| 40) Problem #PRAEBXP "PRAEBXP - 120757 - What is the defin..." |
|
A)
What is the definition of 'residual'? |
Multiple Choice:
|
|
B)
What does it mean if the residual for a given point in a set of data is -.2? |
Multiple Choice:
|
|
Hints: |
|
|
|
|
|
y-hat is the predicted value |
| 41) Problem #PRAD8XV "PRAD8XV - 117880 - Using a TI-83, cr..." |
A)
Using a TI-83, create a scatter plot of the data provided by Seattle Center's Quantitative Environmental Learning Project (data set #018). On the TI-83, start by (stat->edit and imput the X data in L1 and the Y data in L2).
What type of trend does this data set reveal? | |||||||||||||||||||||||
Multiple Choice:
|
|
B)
This data reveals a linear pattern, which allows us to derive a formula from the data in order to predict the number of alternative-fueld vehicles in future years. In order to do this, we must find the equation of the linear regression, or "line of best fit", which in in the form of y=ax+b. After inputting the data into your calculator (stat->edit X and Y), we can find the linear regression by going to (stat->calc->4. LinReg(ax+b)). In this form, a is the slope of the line and b is the y-intercept. What is the value of a (slope) and b (y-intercept) rounded to the nearest tenth? |
Multiple Choice:
|
|
C)
Now we can use this linear regression equation inorder to predict values in the future. Let's start by finding the number of alternative-fueld cars in the year 2005. Because we do not have an actual value figure for the year 2005, we call this EXPECTED value "y-hat". In order to find the number of alternative-fuled cars in the year 2005, we simply start by looking at the equation of the linear regression, or "best fit line", which will tell us the predicted value of Y (y-hat) for an given value of X. y-hat = 18891.2 x - 37355464.7 y-hat = 18891.2 (2005) - 37355464.7 y-hat = 521391.3 Because you can not have .3 of a car, the EXPECTED value for the year 2005 is 521391 alternative-fueld cars. Refering to the example problem above, how many alternative-fueld cars can we expect to see in the year 2010? |
Multiple Choice:
|
|
Hints: |
|
|
|
D)
A linear regression allows us to see the accuracy of the data collected. In order to compare the observed and the expected values of a data set, you must compare the y and y-hat values for a certain point. Let's compare the oberseverd and the expected for two different years, 1992 and 1994. Example 1: X=1992, Y=251352 In order to compare the observed and expected values for 1992, we must first find the expected value (y-hat) because we already know that the observed value (Y) is 251352. Let's solve for y-hat by using our linear regression equation. y-hat = 18891.2 x - 37355464.7 y-hat = 18891.2 (1992) - 37355464.7 y-hat = 275805.7 Because .7 is greater than .5, we can round our expected value to 275806. What is the Expected value for 2007? |
Multiple Choice:
|
|
E)
Let's try and find another EXPECTED value for this data set. Let's predict the number of alternative-fueld cars in the year 2020. Once again, start by plugging in the 2020 into the X value in the linear regression equation. y-hat = 18891.2 x - 37355464.7 y-hat = 18891.2 (2020) - 37355464.7 Now, we can simply slove this problem using algebra and find that... y-hat = 804759.3 for the X value 2020 *IMPORTANT: Remeber that we can not have a fraction of a car so when we round this value, our y-hat becomes 804759. What is the expected number of alternative-fueld cars in the year 2030? |
Algebraic Expression:
|
|
F)
Not only is the linear regression equation used to predict future values, it is also used to test the accuracy, and linearity, of the data. Let's take a look at a previous example... In question 4, we found the EXPECTED value for the year 1992. y-hat = 18891.2 x - 37355464.7 y-hat = 18891.2 (1992) - 37355464.7 y-hat = 275805.7 rounded, y-hat = 275806 for the year 1992. By looking back at the original data collected, we can see that data was collected for the year 1992 and the number of alternative-fueld cars was 251352. Now we have both an observed and an EXPECTED value for 1992, but just how can this information help us test the linearity of the data? Residules are what helps us test the linearity of a data set. By deffinition, a residule is the difference between an observed value of the response variable (X-axis) and the value predicted by the regression line. *Formula: Residual = observed Y - predicted Y r = Y - (Y-hat) Let's find the value of the residule for the year 1992. Observed = 251352 Expected = 275806 r = Y - (Y-hat) r = 251352 - 275806 r = -24454 What is the value of the residule for the year 1994? |
|
Algebraic Expression: |
Scaffold:
| |||||||||||||||||||||||||||||||||||||||||
Scaffold:
|
Scaffold:
|
|
G)
To prove your strength in finding residule values, what is the residule value for the year 1996? *REMEMBER - residule = Y - (y-hat) |
Multiple Choice:
|
|
H)
What is the residule value for the year 1998? *REMEMBER - residule value = Y - (y-hat) |
Multiple Choice:
|
|
I)
Now that we know what residules are, let's look at the bigger picture. Residules are very useful when they are shown on a graph. Graphs showing data based on residule values are known as "residule plots". In order to graph a residule plot, keep the X-values the same (on the x-axis) and, instead of graphing the observed Y-values on the Y-axis, graph the residule values on the Y-axis. Let's take a look at this using a TI-83. In order to graph the residule plot for this data set, make sure that you plug the original data in to the calculator by going to STAT --> EDIT --> and listing the X-values in L1 and the observed Y-values in L2. Eventhough we now know how to calculate the residule value, it would be very time consuming to do that for every X-value in this data set; luckily, our TI-83 can do this quickly and easily for us. In order to find the residule values using the calculator, go to STAT --> EDIT --> scroll over and highlight L3 --> 2nd STAT (list) --> 7 residule --> enter. NOw we have the residule values stored in the L3 of our calculator. So how do we see this on a graph? In order to see the residule plot on our calculator we start by going to 2nd Y= (STAT PLOT) --> 1 PLOT 1 --> enter --> ON & enter --> scroll down to Xlist and make sure it says L1 --> scroll down to Ylist and change it to L3 by hitting 2nd 3. Now we can graph the plot by hitting GRAPH. In this format, you may not be able to see the graph but this problem can be solved by hitting ZOOM and choosing option 9. ZoomStat. Now we can clearly see our residule plot. Residule plots help us judge linearity, but how do we know when a graph is linear or not based on its residule plot? 1. If the pattern of data points produced by the residule plot is very scattered and widley spread, we can say that our data is linear. 2. If our data is very close together and creat a pattern (parabola, repeating pattern, etc.) then we can say that our data is not linear. By looking at the residule plot for the cars data set that we just produced on our calculator, can we say that our data is linear? |
Multiple Choice:
|
| 42) Problem #PRAD879 "PRAD879 - 118140 - Let's look at a d..." |
|
Let's look at a data set comparing women's height and weight: women attach(women) x= height y= weight plot(x,y) ###plots the data set lm(y~x) ###gives us the linear regression equation for the data set cor(x,y) ###gives us the correlation of the data set model= lm(y~x) abline(model) ###plots the least-squares regression line resid= resid(model) plot(x,resid) ###plots the residuals abline(0,0) ###draws a horizontal line at y=0 ###end code Is the LSRL a good representation of the data? |
Multiple Choice:
|
Scaffold:
|
Scaffold:
|
Scaffold:
|
| 43) Problem #PRAD8W9 "PRAD8W9 - 117861 - Let's look at a s..." |
|
A)
Let's look at a set of data in R comparing the age of orange trees and their size: Orange ###shows us the data set x= Orange$age ###defines age as the explanatory variable y= Orange$circumference ###defines circumference as the response variable plot(x,y) ###plots the data set lm(y~x) ###gives us the linear regression equation for the data set cor(x,y) ### gives us the correlation of the data set model= lm(y~x) abline(model) ###plots the least-squares regression line ###end code Is this data linear? |
Multiple Choice:
|
Scaffold:
|
Scaffold:
|
Scaffold:
|
|
B)
What does the LSRL tell us we can assume from the data? |
Multiple Choice:
|
|
Hints: |
|
|
|
|
|
|
| 44) Problem #PRAEABP "PRAEABP - 119207 - Stefano want..." |
|
Stefano wants to determine if the size of a watermelon has a linear relationship with how much sunlight it receives. In order to accomplish this, he is growing his own watermelons, allotting them certain amounts of sunlight. What is the equation for the least squared regression line. Round to the nearest hundreth. Weight (lbs) Sunshine (hours daily) 2.1 4 2.3 4.5 2.7 5 2.9 5.5 3.1 5.7 3.1 5.8 3.3 7 3.6 7.4 |
Multiple Choice:
|
| 45) Problem #PRAEABV "PRAEABV - 119213 - Ms. Lincol..." |
|
Ms. Lincoln is noticing trends in the tests she gives to her history class. She gave a survey after a test that asked her students how long they studied. She then compared the surveys with the scores to determine if they displayed a linear relationship. Hours Studied Score 0.5 72 0.5 78 1 81 1 83 1 87 1 89 2 88 2 91 3 94 What is the equation for the least squared regression line? Round to the nearest hundredth. |
Multiple Choice:
|
| 46) Problem #PRAECZP "PRAECZP - 121780 - Jane is tr..." |
|
Jane is trying to determine if there is a relationship between age and the amount of sleep a person gets. She surveyed classmates at her high school, adults she knows from her job at the community center, as well as some of her younger brother's friends. She did this in order to obtain a broad range of data: Age Hours of Sleep 7 9 8 10 8 9 16 7 16 6 17 6 26 7 29 7 33 6 37 9 43 8 What is the equation for the least squared regression line? Round to the nearest hundredth. |
Multiple Choice:
|
| 47) Problem #PRAEDJC "PRAEDJC - 122297 - A curved pattern ..." |
|
A curved pattern in a residual plot shows that the relationship of the data is... |
Multiple Choice:
|
| 48) Problem #PRAEDJF "PRAEDJF - 122300 - What is the impac..." |
|
What is the impact of an outlier on a regression line? |
Multiple Choice:
|
| 49) Problem #PRAEDJK "PRAEDJK - 122304 - The removal of an..." |
|
The removal of an influential observation... |
Multiple Choice:
|
| 50) Problem #PRAEDJR "PRAEDJR - 122309 - Lynn, a lo..." |
|
Lynn, a local real estate agent, is trying to determine if the size of a house can be used to predict its sale price. In order to determine if there is a relationship, she observed six recent sales in her neighborhood. House Size Price 1,503 $ 162,000 1,272 $ 135, 000 2,216 $ 240, 000 1,861 $ 195,000 1,017 $ 125,000 2,400 $ 262,000 What is the least squared regression line? Round to the nearest hundreth. |
Multiple Choice:
|
| 51) Problem #PRAEDMG "PRAEDMG - 122363 - Amanda is trying ..." |
|
A)
Amanda is trying to figure out how many viewers a television show will have in 2011. The show started in 2000, but Amanda is using that as her zero point, and using a data set that looks like this (with viewers in millions): ###start code x=seq(1,10,by=1) y=c(6,4.3,4.1,3.8,3.7,3.4,3,2.9,2.5,2.1) model=lm(y~x) plot(x,y) abline(model) model ###end code What is the LSRL (exactly as it appears in Rweb and in a+bx form)? |
Algebraic Expression:
|
|
B)
What is the predicted number of viewers for 2011, as it appears on your calculator? |
Algebraic Expression:
|
| 52) Problem #PRAD8XF "PRAD8XF - 117867 - Katy is doing a s..." |
|
Katy is doing
a survey for Perry Pet Grooming. She wants to know if there is a linear
relationship between cat age and weight. She collects data from ten cat owners. Age
Weight (in lb) 3
8 3
10 5
10 6
11 7
11.25 8
12 9
11.5 12
13 15
16.5 15
20 Find the least-squared regression line for this data. |
Multiple Choice:
|
|
Hints: |
|
|
|
|
|
|
| 53) Problem #PRAD9Z8 "PRAD9Z8 - 118914 - Using "cars" data..." |
|
Using "cars" data and Rweb, calculate the least squared regression line for the speed vs. distance data. Type it in exactly as it appears on rweb. |
Algebraic Expression:
|
Scaffold:
|
Scaffold:
|
Scaffold:
|
| 54) Problem #PRAD938 "PRAD938 - 118976 - Lana is looking a..." |
|
Lana is looking at high school and college grades for 200 students at a local state school. She's trying to predict a student's university GPA from his or her high school GPA. If x=high school GPA and y=university GPA, the LSRL equation is y=0.675x+ 1.097. What would the university GPA be for someone who had a 3.2 GPA in high school? Input the answer exactly as it appears on your calculator. |
Algebraic Expression:
|
|
Hints: |
|
|
|
|
| 55) Problem #PRAEABR "PRAEABR - 119209 - Jomelia works as ..." |
|
A)
Jomelia works as a nurse. She measures the height and weight of patients that come into the emergency room. Using the data from the set "women," make a residual plot. (Copy the following into R.) ###start code women names(women) x=women$height y=women$weight plot(x,y) model=lm(y~x) plot(x,y) abline(model) model plot(x,model$residuals,ylab="RESIDUALS") abline(h=0) ###end code What shape does the data take? |
Multiple Choice:
|
|
B)
Is the data linear? |
Multiple Choice:
|
|
Hints: |
|
|
| 56) Problem #PRAEAB7 "PRAEAB7 - 119223 - Taylor is studyin..." |
|
A)
Taylor is studying the effect of x hours of sleep on the ability to use four-syllable words in conversation. The data can be inputed into Rweb using this code: ###start code x=seq(1,10,by=1) y=c(4,6,9,10,14,17,18,20,24,25) model=lm(y~x) plot(x,y) abline(model) model ###end code What is the LSRL? (input the numbers EXACTLY as they appear on Rweb.) y=__________ |
Algebraic Expression:
|
|
B)
Now, let's input an outlier at (3, 22): ###start code x=seq(1,10,by=1) y=c(4,6,9,10,14,17,18,20,24,25) model=lm(y~x) plot(x,y) abline(model) model x=c(x,3) y=c(y,22) model=lm(y~x) plot(x,y) abline(model) model ###end code Does this change the LSRL? (Is the outlier significant?) |
Multiple Choice:
|
| 57) Problem #PRAEBTK "PRAEBTK - 120630 - Hannah is an FBI ..." |
|
A)
Hannah is an FBI Agent. She is looking at data on pirated movies, and trying to figure out if ticket sales decrease as the incidence of movie pirating increases. Since 1900, the ticket sales of movies have decreased with more and more movies being pirated. x=the number of people who have downloaded movies (in millions), and y=the number of tickets sold each year (in billions). ###start code x=c(10,15,18,22,24,28,30,55,60) y=c(1.92,1.88,1.84,1.86,1.8,1.74,1.75,1.62,1.66) model=lm(y~x) plot(x,y) abline(model) model ###end code What is the least squared regression line for the data? |
Multiple Choice:
|
|
B)
Now, add an outlier to the data. In 2008, the ticket sales for The Dark Knight pushed up 2008's ticket sales to 2.02 billion from 1.62 billion. The data now looks like this: ###start code x=c(10,15,18,22,24,28,30,55,60) y=c(1.92,1.88,1.84,1.86,1.8,1.74,1.75,2.02,1.66) model=lm(y~x) plot(x,y) abline(model) model ###end code How significant is this outlier? |
Multiple Choice:
|
| 58) Problem #PRAECZE "PRAECZE - 121772 - Stefano's sister,..." |
|
Stefano's sister, Stefani, is looking at the relationship between the number of ads run and peanut sales. She surveyed 10 companies. # of Ads Run (in thousands) Sales (in thousands) 1 12 1.3 14 1.36 17 1.44 19 1.62 25 1.78 28 2 35 2.14 36 2.56 42 2.79 48 Make a residual plot. According to the residual plot, is this data linear? |
Multiple Choice:
|
|
Hints: |
|
|
| 59) Problem #PRAEDEA "PRAEDEA - 122171 - What is the shape..." |
|
What is the shape of a linear model? |
Multiple Choice:
|
| 60) Problem #PRAEBQ4 "PRAEBQ4 - 120553 - Enter the followi..." |
|
A)
GO to www.stats4stem.org Click on Rweb-1 at the top (near the right) Enter following code: ##Code X=read.table("http://seattlecentral.edu/qelp/sets/038/s038.txt") X ## This names the data from the website "X" attach(X) ## This breaks the data set into variables names(X) ## This shows the names of the variables population=V1 ##This renames V1 "population" disposed=V2 ##This renames V1 "disposed" plot(population, disposed) ## This creates a scatterplot of population versus disposed Look at the scatterplot. Upon initial inspecton, does the data appear linear? |
Multiple Choice:
|
|
B)
Add the following to the previous code: ##Code lsrl=lm(disposed~population) ##This makes the least-squares regression line lsrl ## This displays the least-squares regression line What is the equation of the least-squares regression line? |
Multiple Choice:
|
|
Hints: |
|
yhat=ax+b |
|
|
|
C)
Add the following to the previous code: ##Code: abline(lsrl) ## This graphs the least-squares regression line on the scatterplot Upon second inspection, do you think the linear model fits the data? |
Multiple Choice:
|
|
D)
Add the following to the previous code: ##Code: plot(population,lsrl$residuals, ylab="RESIDUALS", main="RESIDUAL PLOT") ##This creates the residual plot abline(h=0) ##This graphs the horizontal of the residual plot. What does the horizontal line at 0 on the residual plot represent? |
Multiple Choice:
|
|
E)
Looking at the residual plot, do you think the linear model is a good fit for the data? |
Multiple Choice:
|
|
Hints: |
|
|
|
F)
Are there any outliers? |
Multiple Choice:
|
|
Hints: |
|
|
|
G)
Are there any influential observations? |
Multiple Choice:
|
|
Hints: |
|
|
|
H)
What would be affected if the influential observation were removed? |
Multiple Choice:
|
| 61) Problem #PRAEACV "PRAEACV - 119244 - GO to www.stats4s..." |
|
A)
GO to www.stats4stem.org Click on Rweb-1 at the top (near the right) Enter following code: ##Code X=read.table("http://www.statsci.org/data/general/kittiwak.txt", header=T) X ## This names the data from the website "X" attach(X) ## This breaks the data set into variables names(X) ## This shows the names of the variables plot(Area, Population) ## This creates a scatterplot of area versus population Upon first inspection, does the plot appear linear? |
Multiple Choice:
|
|
B)
Add the following code to the code presented above: ##Code lsrl=lm(Population~Area) ## This makes the least-squares regression line lsrl ## This displays the least-squares regression line What is the equation for the least-squares regression line? |
Multiple Choice:
|
|
Hints: |
|
yhat=ax+b |
|
|
|
C)
Add the following code to the code presented above: ##Code abline(lsrl) ## This graphs the least-squares regression line on the scatterplot Upon second inpesction, does the plot appear linear? |
Multiple Choice:
|
|
D)
Add the following to the previous code: ##Code plot(Area,lsrl$residuals,ylab="RESIDUALS",main="RESIDUAL PLOT") ##This creates the residual plot abline(h=0) ##This graphs the horizontal of the residual plot. Looking at the residual plot, do you think the linear model fits the data? |
Multiple Choice:
|
|
Hints: |
|
|
|
E)
Looking at the graphs, are there any outliers? |
Multiple Choice:
|
| 62) Problem #PRAEDEM "PRAEDEM - 122181 - What are three th..." |
|
What are three things you learned? |
|
Ungraded Open Response: |
| 63) Problem #PRAD9M5 "PRAD9M5 - 118539 - In an exponential..." |
|
In an exponential model, what is the regression equation? |
Multiple Choice:
|
|
Hints: |
|
http://stattrek.com/AP-Statistics-1/Transformation.aspx?Tutorial=AP It is very helpful in explaining how to achieve linearity no matter what type of data you are given. |
| 64) Problem #PRAD9Q6 "PRAD9Q6 - 118633 - In a power model,..." |
|
In a power model, what equation do you use to find the predicted value? |
Multiple Choice:
|
|
Hints: |
|
Please refer to this website: http://stattrek.com/AP-Statistics-1/Transformation.aspx?Tutorial=AP It is very helpful in explaining how to achieve linearity no matter what type of data you are given. |
| 65) Problem #PRAD8XH "PRAD8XH - 117869 - Given the followi..." |
|
A)
Given the following data set, figure out the regression equation. X = 1 2 3 4 5 Y = 1 2 4 8 16 |
Multiple Choice:
|
Scaffold:
|
Scaffold:
|
Scaffold:
|
Scaffold:
|
|
B)
Now that you have a regression equation, find an equation that equals to y that you can use to predict values from a given "x". Regression Equation: log(y)=-.301+.301x |
Multiple Choice:
|
|
Hints: |
|
|
|
10^log(y)=y |
|
C)
Now we can use R to check our answers and get a residual plot. Enter the following into R: x=c(1,2,3,4,5) y=c(1,2,4,8,16) plot(x,y) log.y=log10(y) plot(x,log.y) model=lm(log.y~x) abline(model) plot(x, model$residuals, ylab="RESIDUALS") abline(h=0) model According to R, what is the y-intercept? |
Algebraic Expression:
|
|
Hints: |
|
|
|
|
|
|
|
D)
According to R, what is the slope? |
Algebraic Expression:
|
|
Hints: |
|
|
|
|
|
|
|
E)
Now let's take a look at the graphs. The first one is the graph of the data, it is exponential. The second one is the graph of the x-values against the log(y)-values, it is linear. The third graph is the residual plot. Do you see any pattern on the residual plot? |
Multiple Choice:
|
|
F)
Right, there is no pattern on the residual plot. When you are plotting the residuals from a linear graph, there shouldn't be any pattern on the plot. If you tried to plot the residuals from a non-linear graph, there would be a pattern (U-shaped or something else). This website explains it well: stattrek.com/Help/Glossary.aspx?Target=Residual%20plot What did you learn from this assistment? |
|
Ungraded Open Response: |
| 66) Problem #PRAEAW3 "PRAEAW3 - 119777 - The true antelope..." |
|
A)
The true antelopes are found only in Africa and Asia. They range in size from 12" (30 cm. at the shoulder) pygmy antelopes to giant elands, which are over 6 feet tall (180 cm) at the shoulder. Most antelopes are between 3 to 4 feet tall (90-120 cm) at the shoulder. The horns of antelopes, unlike the antlers of deer, are un-branched, are made of a shell with a bony core, and are not shed. The majority of antelopes reside in Africa. Data: The data below represents the length and mid-shaft diameters of the humerus bones of African Antelopes.
Prepare a scatter plot of the data using R. Enter the following into R: x=c(17.6,26.0,31.9,38.9,45.8,51.2,58.1,64.7,66.7,80.8,82.9) y=c(159.9,206.9,236.8,269.9,300.6,323.6,351.7,377.6,384.1,437.2,444.7) plot(x,y) Were you able to make a scatterplot? |
Multiple Choice:
|
|
Hints: |
|
|
|
B)
Using R, find the linear regression model for the data. Enter the following into R: x=c(17.6,26.0,31.9,38.9,45.8,51.2,58.1,64.7,66.7,80.8,82.9) y=c(159.9,206.9,236.8,269.9,300.6,323.6,351.7,377.6,384.1,437.2,444.7) plot(x,y) log.x=log10(x) log.y=log10(y) plot(log.x,log.y) model=lm(log.y~log.x) abline(model) plot(x, model$residuals, ylab="RESIDUALS") abline(h=0) model What is the y-intercept? |
Algebraic Expression:
|
|
Hints: |
|
|
|
|
|
|
|
C)
What is the slope? |
Algebraic Expression:
|
|
Hints: |
|
|
|
|
|
|
| 67) Problem #PRAEBTA "PRAEBTA - 120621 - Now for some more..." |
|
A)
Now for some more practice on R. Enter the following into R: x=c(1,2,3,4,5) y=c(1,2,8,28,85) plot(x,y) log.y=log10(y) plot(x,log.y) model=lm(log.y~x) abline(model) plot(x, model$residuals, ylab="RESIDUALS") abline(h=0) model What kind of model is this data set? |
Multiple Choice:
|
|
Hints: |
|
|
|
B)
According to R, what is the y-intercept of the linear regression equation? |
Algebraic Expression:
|
|
Hints: |
|
|
|
|
|
|
|
C)
What is the slope? |
Algebraic Expression:
|
|
Hints: |
|
|
|
|
|
|
|
D)
Is the residual plot random or does it have a pattern? |
Multiple Choice:
|
|
E)
Because of the residual plot, is it a good linear model? |
Multiple Choice:
|
|
Hints: |
|
http://stattrek.com/Help/Glossary.aspx?Target=Residual plot |
| 68) Problem #PRAEAV8 "PRAEAV8 - 119751 - In a residual plo..." |
|
A)
In a residual plot, when is a linear regression model appropriate for the data? |
Multiple Choice:
|
|
Hints: |
|
Please refer to this website: http://stattrek.com/AP-Statistics-1/Transformation.aspx?Tutorial=AP It is very helpful in explaining how to achieve linearity no matter what type of data you are given. |
|
B)
Make sure to check out this website for a full breakdown of how to achieve linearity from different types of data sets using transformations: http://stattrek.com/AP-Statistics-1/Transformation.aspx?Tutorial=AP Did you find this website useful? |
Multiple Choice:
|
| 69) Problem #PRAEC3D "PRAEC3D - 121833 - This data set is ..." |
|
This data set is a little harder! X Y 8 9.64 21 27.61 54 77.01 67 98.64 98 146.04 12 15.007 34 46.70 99 149.02 22 29.15 Find Y when X is 105. Round to the nearest hundredths. |
Algebraic Expression:
|
Scaffold:
|
Scaffold:
|
Scaffold:
|
| 70) Problem #PRAEBUE "PRAEBUE - 120656 - Lets start with a..." |
|
Lets start with a simple data set! x y 1 2 2 4 3 8 4 16 5 32 6 64 7 128 8 256 9 512 Find Y when X is 25 |
Algebraic Expression:
|
Scaffold:
|
Scaffold:
|
Scaffold:
|
| 71) Problem #PRAEACR "PRAEACR - 119240 - Now that you know..." |
|
Now that you know a little more about linear transformations lets try another problem! Given the data set X Y 89 6161
106 7477
52 4336
38 3612
0.01 3065
91 5446
50 3800
Greglangkamp and Joe Hull, "Exponential Scatterplots," QELP, October 27,2010
http://seattlecentral.edu/qelp/sets/045/045.html
Find Y when X is 150 round to the nearest hundredths
|
Algebraic Expression:
|
Scaffold:
|
Scaffold:
|
Scaffold:
|
| 72) Problem #PRAD869 "PRAD869 - 118109 - Exponential Trans..." |
|
Exponential Transformations. When do we use Exponential Transformations? Well, exponential transformations are used to asses the correlation (strength and direction) of the exponential transformation. They are also used to create a Least-Squares Regression Line, which can later be used to predict future points on the same exponential track as the previous points. Lets try it out! Heres a data set; I will walk you through how to complete a exponential Transformation using this data set. X Y
-40	0.1
-30	0.3
-20	0.75
-10	2
0	3.5
5	5
10	7
15	10
20	14
25	20
30	26.5
35	35
40	47
1) First enter this data set into your calculator. (press STAT, EDIT, enter the first column into L1 and the second into L2)
2) Next press second STAT PLOT (above Y=), ENTER change Xlist to L1 and Ylist to L2, Then press ZOOM, 9 (ZoomStat)
3) This lets us view the original graph
4)Next press STAT, EDIT, move over to L3, then press log(L2). This takes the log of each of the original Y variables.
5) Repeat step 2 replacing Ylist to L3 to view this graph.
6) Next press STAT, move over to CALC, then move down to 8 [LinReg(a+bx)]
7) Then type L1,L3 then hit Enter.
8) Your r should be .9947465551 your r^2 should be .9895207089
9) Now in order to conver this to a form in which we can predict future point we must convert it.
10) Since this is technically log(y-hat)=a+bx (.4793)+(.0324)(X) we must change it so that y-hat is by itself.
11) Do this by taking the inverse log of both sides (10^X) or (2nd LOG) of both side.. you should end up with y-hat=3.0156*1.0775^X Now simply plug in a number for X and the equation will predict the Y variable for you!
Question: Given the above data set and equation what will Y be when X is 50?
|
Multiple Choice:
|
| 73) Problem #PRAEDK9 "PRAEDK9 - 122356 - This is a data se..." |
|
This is a data set of the amount of nitrogen used on a crop, and the crop yield. X Y 122.3 6449
102.4 7483
104.1 7874
101.0 8034
106.0 8419
113.7 9362
146.0 10080
168.9 11959
198.3 9928
254.1 11850
408.4 16001
602.1 18753
635.3 21412
What is the equation of the Power Transformation Equation?
|
Multiple Choice:
|
|
Hints: |
|
|
|
|
|
|
|
|
| 74) Problem #PRAEBUB "PRAEBUB - 120653 - Here is a new dat..." |
|
Here is a new data set about Madrid's earth quakes and the size of the magnitude X Y 5.34 4.01
4.5 3.91
4.88 4.38
3.84 2.66
4.71 3.67
4.83 3.87
4.43 2.89
3.06 1.11
4.92 3.46
4.92 3.6
4.39 3.04
4.27 2.93
4.82 4.03
3.54 3.21
2.22 1.23
5.66 4.47
4.04 3.24
4.68 3.46
4.83 3.5
2.53 0.78
4.61 3.63
4.2 3.19
4.25 3.04
5.83 4.94
4.64 3.06
What is R-squared value of the regression line (a + bx) when you use the power model? |
Algebraic Expression:
|
Scaffold:
|
Scaffold:
|
Scaffold:
|
Scaffold:
|
| 75) Problem #PRAEDK4 "PRAEDK4 - 122351 - Here is a data li..." |
|
Here is a data list of gas mileage compared to engine size. X Y 1.8 29
2.3 31
1.8 32
2.5 31
2.8 29
3.8 30
2.2 34
2.4 33
1.0 47
1.3 43
2.0 33
3.8 29
1.6 37
1.6 43
2.2 27
1.5 37
2.0 33
2.4 30
1.8 36
1.6 39
2.0 31
2.2 34
2.4 33
1.9 38
1.6 37
2.0 35
1.3 43
1.5 40
2.0 31
2.0 31
1.8 32
1.8 37
2.0 31
2.4 30
2.5 27
1.6 36
1.5 36
2.0 31
2.0 32
2.0 39
2.0 34
2.0 37
2.0 33
2.0 31
1.8 31
2.0 34
2.0 37
1.6 34
1.8 30
2.4 31
2.0 39
1.9 38
2.2 32
1.8 38
2.0 32
2.0 31
2.3 28
http://seattlecentral.edu/qelp/sets/036/036.html What is the equation for the power transformation of the above data?
|
Multiple Choice:
|
|
Hints: |
|
|
|
|
|
|
| 76) Problem #PRAD868 "PRAD868 - 118108 - Power transformat..." |
|
A)
Power transformations involves taking the log of both data sets and graphing the new data sets to achieve linearity. To take the logs of the data set you must input a set of data into your calculator first. All of the power transformations will be done eith the calculator. Here is a data set to help practice how to do this procedure. Follow these steps with the data set provided. 1 2940600
70 13094400
109 28953600
173 40379580
242 56427280
322 64593200
376 75072000
547 88965600
603 100742400
699 115814504
872 152472840
922 154291740
1087 173260800
1343 178320000
1692 212908800
1858 243579520
http://seattlecentral.edu/qelp/sets/020/020.html
List of steps to enter data into the calculator:1) Press "STAT" 2) Go into "Edit" by pressing 1 or "ENTER" 3) Data on the X axis goes in L1 4) Data on the Y axis goes in L2 5) Graph the data set by going into "ZOOM" and click on "ZoomStat" or 9 6) If this data set graphs correctly skip steps 7, 8, 9, and 10 7) If this doesnt work its probly becuse the dimensions arent correct. To change them so this will graph go to "STAT PLOT" which is right above "Y=" on the calculator. 8) After you're in "STAT PLOT" click enter on Plot 1 9) Go down to "Xlist" and set it to L1 and change "Ylist" to L2 10) Go back to "ZOOM" and click "ZoomStat" to graph this data 11) What do you notice? The graph should not be linear right? Now we will try top change that 12) To achieve linearity we must take the log of both L1 and L2 13) To do this go back into "STAT" click edit and you should see your data set in L1 and L2 14) Go over L3 and highlight it by pressing up on the directional pad. The blinking black cursor should be over L3. After you do this press '"LOG" then press L1 and click enter. This should give you a new column of data 15) Go over to L4 and highlight it by pressing up on the directional pad.The blinking black cursor should be over L4. After you do this press '"LOG" then press L2 and click enter. This should give you a new column of data 16) To graph this go back into "STAT PLOT" and go to Plot 1. Go down to "Xlist" and change L1 to L3. Go down to "Ylist" and change L2 to L4. This will change the dimensions of your new graph. 17) Go to "ZOOM" and click 9 or "ZoomStat" 18) If done correctly this should show you a new graph that is very linear. 19) To confirm linearity click "STAT", go over to "CALC", and click "LinReg(a+bx)". Then enter L3 insert a comma and press L4 then press enter. This should give you a few numbers but the one you're most concerned with is r squared. If this number is anywhere from .8 to .99 then you have a very strong linear relationship. 20) This data that you have just accumulated will be very useful in the following problems. |
Algebraic Expression:
|
Scaffold:
|
Scaffold:
|
Scaffold:
|
Scaffold:
|
| B) |
|
Algebraic Expression: |
| C) |
|
Algebraic Expression: |
| 77) Problem #PRAEEWQ "PRAEEWQ - 123610 - One day Roger dec..." |
|
A)
One day Roger decides to make a loan of 25 dollars from a local loan shark. Little does he know, the interest rate is 3.0 per week. Roger does not pay for 5 weeks and soon becomes heavily in dept. Graph the data below in your graphing calcutor. Is the graph linear? Weeks: 1, 2, 3, 4, 5 Dept: 25, 75, 225, 675, 2025 |
Multiple Choice:
|
Scaffold:
|
Scaffold:
|
|
B)
Now since we've identified this as an exponential graph, let's make it linear with a transformation. Using Log on your graphing calculator, use exponential transformation to find a linear graph. Did you succeed? |
Multiple Choice:
|
Scaffold:
|
Scaffold:
|
|
C)
What is the slope and y-intercept of the line? |
Multiple Choice:
|
|
Hints: |
|
a is the y-intercept. b is the slope |
|
D)
What is the equation of the problem? |
Multiple Choice:
|
|
Hints: |
|
>model to find the equation of the line. |
|
E)
How would I arrive with an equation of just y-hat = a+bx? |
Multiple Choice:
|
| 78) Problem #PRAD877 "PRAD877 - 118138 - Two-Way Tables Introduction" |
|
A)
Go to http://stattrek.com/AP-Statistics-1/Association.aspx?Tutorial=AP for a quick run-through on two-way frequency tables and use this as a reference.
Given the table above, how many total people are described in the two-way table? StatTrek.
“AP* Statistics Tutorial: Two-Way Tables.” Accessed October 25, 2010. http://stattrek.com/AP-Statistics-1/Association.aspx?Tutorial=AP. |
Multiple Choice:
|
|
Hints: |
|
|
B)
In the two-way table above, define the row variable and column variable. (Row Variable; Column Variable) |
Multiple Choice:
|
C)
Using the table above, give the marginal distribution of participation in sports club as a percentage. Ignore the percent sign (%) in your answer. |
Algebraic Expression:
|
Scaffold:
|
Scaffold:
|
Scaffold:
|
Scaffold:
|
D)
Out of the dance club only, what is the conditional frequency of girls? Round to the nearest hundredth. |
Multiple Choice:
|
|
Hints: |
|
|
| 79) Problem #PRAEDRS "PRAEDRS - Bar Charts Marginal Distributions" |
|
A)
Based on the bar graph above, what is the marginal distribution of deaths per vehicle kilometers traveled of people aged 55 and older? Ignore the percent sign (%) in your answer and round to the nearest hundredth if necessary.
Raise the Hammer.
“Stay In Your Lane: on plucking the low-lying fruit of safe driving.” Accessed October 25, 2010. http://www.raisethehammer.org/article/609/stay_in_your_lane. |
Algebraic Expression:
|
|
Hints: |
|
|
|
|
|
|
B)
 Using the same bar graph, give the marginal distributions of the youngest age group and oldest age group in percentages. (Youngest age group; Oldest age group) |
Multiple Choice:
|
|
Hints: |
|
|
|
C)
Based on the graph above, which age group(s) seem(s) to be the safest drivers? Why? |
Multiple Choice:
|
| 80) Problem #PRAEDSH "PRAEDSH - 122519 - Stacked Bar Graph..." |
|
A)
Stacked bar graphs are used to easily compare parts of a whole. For example the different colors (blue, black, red, etc.) are part of a whole category (least favorite color).
What can be observed from the color, orange, in this stacked bar graph?
Joe Hallock. "Colour Assignment: Preferences." Accessed October 27th, 2010. http://www.joehallock.com/edu/COM498/preferences.html. |
Multiple Choice:
|
|
Hints: |
|
|
|
What happens to the percentage of the color orange as age increases? Do the percentages get larger or smaller? What does this represent? |
B)
 Assuming that all age groups contain the same number of surveyed people, which color is considered the most liked? |
Multiple Choice:
|
|
Hints: |
|
|
|
C)
What does the absence of blue in age groups under 70 years old represent? |
Multiple Choice:
|
|
D)
Comparing the colors purple and green, which one is better liked? Why? |
Multiple Choice:
|
| 81) Problem #PRAEDSM "PRAEDSM - Two-Table STDs" |
|
A)
How many people Moroccans were infected with syphilis in 1991 and 1992? International Encyclopedia of Sexuality. "Morocco." Accessed October 27, 2010. http://www2.hu-berlin.de/sexology/IES/morocco.html. |
Multiple Choice:
|
B)
 What is the marginal distribution of Moroccans who were infected with STDs in 1997? |
Multiple Choice:
|
|
Hints: |
|
|
|
|
|
|
|
C)
What is the conditional distribution of other STDs in 1995? Round your answer to the nearest hundredth. |
Multiple Choice:
|
|
Hints: |
|
|
|
D)
Which type of STD is the most uncommon among Moroccans between the years of 1991-1998? |
Multiple Choice:
|
| 82) Problem #PRAEDS3 "PRAEDS3 - R Two-Way Tables" |
|
A)
Now it's time to use the R-program to further understand two-way frequency tables. ------------ START CODE sexsmoke<-matrix(c(70,120,65,140),ncol=2,byrow=TRUE) rownames(sexsmoke)<-c("male","female") colnames(sexsmoke)<-c("smoke","nosmoke") sexsmoke <- as.table(sexsmoke) sexsmoke --------------- END CODE Scrolling down, you should get a two-way frequency table comparing the amount of males and females who smoke or don't smoke. What is the total amount of people represented in this data? Check your answer by entering the line below into R, which will give you the total amount of people represented in this data. margin.table(sexsmoke) Cyclismo. "R Tutorial: Tables." Accessed October 28, 2010. http://www.cyclismo.org/tutorial/R/tables.html. Cyclismo. "R Tutorial: The Basic Data Types." Accessed October 28, 2010. http://www.cyclismo.org/tutorial/R/types.html. |
Multiple Choice:
|
|
B)
Add the following line in: sexsmoke/margin.table(sexsmoke) What do you think this new data set gives us? |
Multiple Choice:
|
|
C)
Using the marginal distribution table created from the previous problem, determine which group has the lowest marginal distribution. |
Multiple Choice:
|
|
D)
Enter the line prop.table(sexsmoke, 2) This gives us the Relative Frequency of Column Table, which gives us the conditional frequencies of smokers and non-smokers. What is the conditional frequency of women who smoke? |
Multiple Choice:
|
|
E)
Which of the following statements best describe the data, based on your observations from the Marginal Frequency Table and Relative Frequency of Column Table? Check all statements that apply. |
Check All That Apply:
|
| 83) Problem #PRAD9M2 "PRAD9M2 - Assistment Question 1" |
|
From: https://oli.web.cmu.edu/jcourse/workbook/activity/page?context=90de571d80020ca60104b2620b3f3e00&view=frameset Suppose you want to determine the musical preferences of all students at your university, based on a sample of students. Here are some examples of the many possible ways to pursue this problem. 1. Post a music-lovers' survey on a university internet bulletin board, asking students to vote for their favorite type of music. This is an example of a volunteer sample, where individuals have selected themselves to be included. Such a sample is almost guaranteed to be biased. In general, volunteer samples tend to be comprised of individuals who have a particularly strong opinion about an issue (and are just waiting for an opportunity to voice it....). Whether the variable's values obtained from such a sample are over- or under-stated, and to what extent, cannot be determined. As a result, data obtained from a voluntary response sample is quite useless when you think about the "Big Picture" since the sampled individuals only provide information about themselves, and we cannot generalize to any larger group at all. Comment: As we will see in our discussion of study design, a volunteer sample is not so problematic when it is taken for the purpose of carrying out an experiment where individuals are randomly assigned to different treatment groups. 2. Stand outside the Student Union, across from the Fine Arts Building, and ask students passing by to respond to your question about musical preference. This is an example of a convenience sample, where individuals happen to be at the right time and place to suit the schedule of the researcher. Depending on what variable is being studied, it may be that a convenience sample provides a fairly representative group. However, there are often subtle reasons why the sample's results are biased. In this case, the proximity to the Fine Arts Building might result in a disproportionate number of students favoring classical music. A convenience sample may be susceptible to bias because certain types of individuals are more likely to be selected than others. In the extreme, some convenience samples are designed in such a way that certain individuals have no chance at all of being selected, as in the next example. 3. Ask your professors for email rosters of all the students in your classes. Randomly sample some addresses, and email those students with your question about musical preference. Here is a case where the sampling frame---list of potential individuals to be sampled---does not match the population of interest. The population of interest consists of all students at the university, whereas the sampling frame consists of only your classmates. There may be bias arising because of this discrepancy. For example, students with similar majors will tend to take the same classes as you, and their musical preferences may also be somewhat different from those of the general population of students. It is always best to have the sampling frame match the population as closely as possible. 4. Obtain a student directory with email addresses of all the university's students, and send the music poll to every 50th name on the list. This is called systematic sampling. It may not be subject to any clear bias, but it would not be as safe as taking a random sample. If individuals are sampled completely at random, and without replacement, then each group of a given size is just as likely to be selected as all the other groups of that size. This is called a simple random sample (SRS). In contrast, a systematic sample would not allow for sibling students to be selected, because of having the same last name. In a simple random sample, sibling students would have just as much of a chance of both being selected as any other pair of students. Therefore, there may be subtle sources of bias in using such a sampling plan. 5. Obtain a student directory with email addresses of all the university's students, and send your music poll to a simple random sample of students. As long as all of the students respond, then the sample is not subject to any bias, and should succeed in being representative of the population of interest. But what if only 40% of those selected email you back with their vote? The results of this poll would not necessarily be representative of the population because of volunteer response. Since individuals are not compelled to respond, often a relatively small subset take the trouble to participate. Volunteer response is not as problematic as a volunteer sample (presented in (1) above), but there is still a danger that those who do respond are different from those who don't, with respect to the variable of interest. An improvement would be to follow up with a second email, asking politely for students' cooperation. This may boost the response rate, resulting in a sample that is fairly representative of the entire population of interest, and it may be the best that you can do, under the circumstances. Non-response is still an issue, but at least you have managed to reduce its impact on your results. Did You Read This? (We know that it's long, but it will really help!) |
Multiple Choice:
|
| 84) Problem #PRAD9NK "PRAD9NK - Assistment Question 2" |
|
We want to find out who the senior class wants to DJ prom. We post a sheet outside of the guidance office asking students to write their preference. This is an example of what kind of survey? |
Multiple Choice:
|
|
Hints: |
|
|
| 85) Problem #PRAD9NS "PRAD9NS - Assistment Question 3" |
|
Refer to Question 2, the volunteer sample. Is this sample biased? |
Multiple Choice:
|
| 86) Problem #PRAD9R6 "PRAD9R6 - Assistment Question 4" |
|
Refering to the volunteer sample in Question 2 why is it biased? Keep in mind that answers come right from the passage in Question 1. |
Check All That Apply:
|
| 87) Problem #PRAEAWF "PRAEAWF - Assistments Question 5" |
|
We want to know who the Boston Latin School Senior Class' favorite teacher is (besides Mr. Simoneau). We obtain a list of every senior in the school. We ask every third senior who their favorite teacher is. This is an example of what kind of survey? |
Multiple Choice:
|
|
Hints: |
|
|
| 88) Problem #PRAEAWQ "PRAEAWQ - Assistments Question 6" |
Multiple Choice:
|
| 89) Problem #PRAEAW4 "PRAEAW4 - Assistments Question 7" |
Multiple Choice:
|
|
Hints: |
|
|
| 90) Problem #PRAEAW8 "PRAEAW8 - Assistments Question 8" |
|
A Health Science Magazine, Doctors Learn (DL), wants to know which Boston college's students drink the most alcohol. They will find out by asking students how many alcoholic beverages they have per week. The following are two ways that DL could go about surveying the students: a. DL surveys all of the students in every college's Education, Nursing, Engineering, Business, and International Relations Majors. b. DL surveys 10 students in every major at every college. |
Exact Match (case sensitive):
|
|
Hints: |
|
|
| 91) Problem #PRAECY4 "PRAECY4 - Assistments- Question 9" |
|
A Census is used to find out different facts about people living in a certain area. Let's use the United States Census as our example. The US census is taken every ten years. The US census is the way that the government knows about the population of the United States. How does the government know how many buses it should run in a certain area? Through the census the government knows how many people live in a specific area and how many of those people rely on public transportation. Here is a link to the United States Census http://2010.census.gov/2010census/ The following questions will be about this site. Under the "How It Works" page the site says that the Census is used to allocate funds for .... |
Check All That Apply:
|
|
Hints: |
|
|
| 92) Problem #PRAECZA "PRAECZA - Assistments Question 10" |
|
On the Census homepage click on the "Learn More About Data Processing Link" and watch the video. (It won't kill you. It's less than a minute.) Answer the following questions about the video. The video explains that the census is used to determine how many seats a state gets in the U.S. House Of Representatives. True or False? |
Multiple Choice:
|
| 93) Problem #PRAEDMR "PRAEDMR - 122371 - Assistment Question 11" |
|
- Carry out an observational study, where values of the variable or variables of interest are recorded as they naturally occur. There is no interference by the researchers who conduct the study. - Take a sample survey, which is a particular type of observational study where individuals report variables' values themselves, frequently by giving their opinions. - Perform an experiment: instead of assessing values of variables as they naturally occur, the researchers interfere, and they are the ones who assign values of the explanatory variable to the individuals. The reason why the researchers "take control" of the values of the explanatory variable is because they want to see how changes in the values of the explanatory variable affect the response. (Note: By nature, any experiment, then, involves at least two variables) The type of design used, and the details of the design, are crucial, since they will determine what kind of conclusions we may draw from the results. In particular, when studying relationships in the Exploratory Data Analysis unit, we stressed that an association between two variables does not guarantee that a causal relationship exists. In this module, we will explore how various details of a study design play a crucial role in our ability to establish evidence of causation.
Notice that in Example 2, the values of the variables of interest (TV and Snacking Habits) are recorded forward in time. Such observational studies are called prospective. In contrast, in Example 3 the values of the variables of interest are recorded backward in time. This is called a retrospective observational study. N.B. This material, as well as the following 4 questions were taken from https://oli.web.cmu.edu/jcourse/workbook/activity/page?context=90e062da80020ca601f85ed29d5c001c&view=frameset a creative commons website. |
Multiple Choice:
|
| 94) Problem #PRAEDMW "PRAEDMW - 122376 - Assistments Question 12" |
|
Identify the type of design in the following scenario: An internet poll asks people to vote on their favorite American Idol singer. This is an example of ___________ kind of study. |
Multiple Choice:
|
| 95) Problem #PRAEDM2 "PRAEDM2 - 122380 - Assistment Question 13" |
|
Identify the type of study: Researchers compared the rates of autism for children who did and did not receive the standard measles-mumps-rubella vaccine, to see if the vaccine was responsible for autism in some children. |
Multiple Choice:
|
| 96) Problem #PRAEDM4 "PRAEDM4 - 122382 - Assistment Question 14" |
|
Identify the type of study: Researchers injected some patients' underarms with Botox, and others with salt water, in order to see if Botox (which was originally intended to smooth wrinkles) would also reduce sweating. |
Multiple Choice:
|
| 97) Problem #PRAEDM5 "PRAEDM5 - 122383 - Assistment Question 15" |
|
Identify the type of study: Researchers classified pregnant women as being non-drinkers or light, moderate, or heavy drinkers; they examined the weights of their children at regular age intervals to see if alcohol during pregnancy results in poor growth. |
Multiple Choice:
|
| 98) Problem #PRAEAWK "PRAEAWK - 119762 - Problem #119762" |
|
Algebraic Expression: |
| 99) Problem #PRAD8TH "PRAD8TH - 117745 - Census" |
|
A)
Use the internet to find the definition of a census. What is the purpose of a census? |
Multiple Choice:
|
|
B)
The US Census is conducted every __________ years. |
Algebraic Expression:
|
|
Hints: |
|
C)
The 2000 US Census data can be found here: http://www2.census.gov/census_2000/datasets/demographic_profile/0_United_States/2kh00.pdf We can use this data to estimate the population percentages for any state given their population. Go to page 3 and find what percentage of the US population is Male. What is that percentage? |
Algebraic Expression:
|
|
D)
Using the percentage found in the previous problem, what percentage of the population in Massachusetts would you expect to be male? |
Algebraic Expression:
|
|
E)
If the population is 6.4 Million in Massachusettes and you expect to have 49.1% male, how many males do you expect to live in MA? |
Algebraic Expression:
|
Scaffold:
|
Scaffold:
|
Scaffold:
|
|
F)
According to the 2000 MA Census Data, there were 3,058,816 men in MA, not 3,142,400, as we estimated in the previous problem. How far off were you from the actual number (in positive percentages)? |
Algebraic Expression:
|
Scaffold:
|
Scaffold:
|
Scaffold:
|
|
G)
Write a reflection about what you have learned about census data collecting and how this information can be used? |
|
Ungraded Open Response: |
|
H)
Do you understand census data collection? |
Check All That Apply:
|
| 100) Problem #PRAEDUA "PRAEDUA - 122574 - Sampling" |
|
A)
Go to http://en.wikipedia.org/wiki/Survey_sampling What is the definition/purpose of Survey sampling? |
Multiple Choice:
|
|
B)
What does a sample survey often entail? (Refer to the website provided in the previous question) |
Multiple Choice:
|
|
C)
What is the difference between a survey and a census? (Respond in 2-3 Sentences) |
|
Ungraded Open Response: |
|
D)
If deduction is essentially going from the larger picture to the smaller picture, what can deduction be compared to: census or sample survey? |
Multiple Choice:
|
|
E)
If induction is essentially going from the smaller picture to the larger picture, what can induction be compared to: census or sample survey? |
Multiple Choice:
|
| F) |
Multiple Choice:
|
|
G)
Write 2-3 Sentences about the differences between a census and a sample survey. |
|
Ungraded Open Response: |
| 101) Problem #PRAEAFS "PRAEAFS - 119334 - sampling" |
|
A)
sampling involves |
Multiple Choice:
|
|
B)
which of the following is not a type of sampling? |
Multiple Choice:
|
|
C)
True or false; Undercoverage occurs when an individual chosen from the sample can't be contacted or does not cooperate? |
Multiple Choice:
|
|
D)
Nike wants to know what type of sneakers high school athletes wear. They send out surveys to 100 High school sports teams at random. They receive 76 back. What is the population for this study? and what is the sample? |
Multiple Choice:
|
|
E)
Do you know what "Table B" is? |
Multiple Choice:
|
|
F)
SRS |
|
Algebraic Expression: |
| 102) Problem #PRAEDUR "PRAEDUR - 122588 - Experimenting and Observational Study" |
|
A)
Go to the following website and find the definition of an experiment. http://stattrek.com/AP-Statistics-2/Experiment.aspx?Tutorial=Stat |
Multiple Choice:
|
|
B)
Go to the following website about observational studies. What is the definition of an observational study? http://en.wikipedia.org/wiki/Observational_study |
Multiple Choice:
|
|
C)
What are the differences between an experiment and observational study? |
Multiple Choice:
|
| 103) Problem #PRAEABD "PRAEABD - 119198 - Sample surveys is..." |
|
Sample surveys is another method of data collection. There are 30 students in the class. These are the test scores taken from a sample survey. 74, 89, 68, 95, 100, 96, 70, 79, 90 Does this data reflect exactly how the entire class did? |
Multiple Choice:
|
Scaffold:
|
Scaffold:
|
| 104) Problem #PRAEBVJ "PRAEBVJ - 120691 - Suppose ABC Colle..." |
|
Suppose ABC College has 10,000 part-time students (the population). We are interested in the average amount of money a part-time student spends on books in the fall term. Asking all 10,000 students is an almost impossible task. Suppose we take two different samples. First, we use convenience sampling and survey 10 students from a first term organic chemistry class. Many of these students are taking first term calculus in addition to the organic chemistry class . The amount of money they spend is as follows: $128; $87; $173; $116; $130; $204; $147; $189; $93; $153 The second sample is taken by using a list from the P.E. department of senior citizens who take P.E. classes and taking every 5th senior citizen on the list, for a total of 10 senior citizens. They spend: $50; $40; $36; $15; $50; $100; $40; $53; $22; $22 Do you think that either of these samples is representative of (or is characteristic of) the entire 10,000 part-time student population? |
Multiple Choice:
|
Scaffold:
|
Scaffold:
|
| 105) Problem #PRAEACW "PRAEACW - 119245 - What sampling tec..." |
|
A)
What sampling technique is being used in this scenario? Voters are selected at random from an alphabetical list of all registered voters. Source: N/A, "Sampling (2 of 2)," Open Learning, N/A, https://oli.web.cmu.edu/jcourse/workbook/activity/page?context=90e062c080020ca6007985a9a1b18479&view=frameset |
Multiple Choice:
|
|
Hints: |
|
Cluster Sampling: when our population is naturally divided into groups (clusters). For example, all the students in a university are divided into majors; all the nurses in a certain city are divided into hospitals; all registered voters are divided into precincts (election districts). In cluster sampling we take random sample of clusters, and use all the individuals within the selected clusters as our sample. For example, in order to get a sample of high-school senior from a certain city, you choose 3 high-schools at random from among all the high-schools in that city, and use all the high-school seniors in the three selected high-school as your sample. Stratified Sampling: when our population is naturally divided into sub-populations (starta). For example, all the students in a certain college are divided by gender or by year in college; all the registered voters in a certain city are divided by race. In stratified sampling, we choose a simple random sample from each stratum, and our sample consists of all these simple random samples put together. For example, in order to get a random sample of high-school seniors from a certain city, we choose a random sample of 25 high-school seniors from each of the high-schools in that city. Our sample consists of all these samples put together. . Systematic sampling: when an organized (but not random) approach to the selection process is taken, such as picking every 50th name on a list, or the first product to come off the production line each hour. Source: N/A, "Sampling (2 of 2)," Open Learning, N/A, https://oli.web.cmu.edu/jcourse/workbook/activity/page?context=90e062c080020ca6007985a9a1b18479&view=frameset |
|
B)
What sampling technique is being used in this scenario? Voters are selected by choosing at random several of the city's zip codes and selecting all the voters from those selected zip codes. Source: N/A, "Sampling (2 of 2)," Open Learning, N/A, https://oli.web.cmu.edu/jcourse/workbook/activity/page?context=90e062c080020ca6007985a9a1b18479&view=frameset |
Multiple Choice:
|
|
C)
What sampling technique is being used in this scenario? Several pieces of fruit from each tree in an orchard are selected. Source: N/A, "Sampling (2 of 2)," Open Learning, N/A, https://oli.web.cmu.edu/jcourse/workbook/activity/page?context=90e062c080020ca6007985a9a1b18479&view=frameset |
Multiple Choice:
|
| 106) Problem #PRAD827 "PRAD827 - 117983 - Which two of the ..." |
|
Which two of the basic principles of statiscal design of experiments help prevent bias, or systematic favoritism, in experiments? |
Multiple Choice:
|
|
Hints: |
|
|
| 107) Problem #PRAD8WJ "PRAD8WJ - 117839 - There is one main..." |
|
There is one main difference between experiments and observational studies: in experiments, the explanatory variable is set for a certain sample of test subjects, whereas in observational studies, the explanatory variable is set by the test subjects themselves. Which of the following scenarios describes a situation in which the method of data collection is an observational study? |
Multiple Choice:
|
|
Hints: |
|
|
| 108) Problem #PRAD87J "PRAD87J - 118118 - Last year 20% of ..." |
|
Last year 20% of a group of adult women did not have a cold throughout the year. This year they participated in study in which they all took Echinacea capsules every day and 30% did not get a cold. It was concluded that Echinacea capsules prevent colds. Source: N/A, "Understanding Statistics", Australian Bureau of Statistics, November 13, 2009, http://www.abs.gov.au/websitedbs/a3121120.nsf/4a256353001af3ed4b2562bb00121564/ce88a10d17c46b56ca257610000a9364!OpenDocument What method of data collection was used to draw this conclusion? |
Multiple Choice:
|
| 109) Problem #PRAD87R "PRAD87R - 118124 - A study of engine..." |
|
A study of engineers showed that those who had completed a certificate earned 10% more, on average, than those who had completed a degree. Source: N/A, "Understanding Statistics", Australian Bureau of Statistics, November 13, 2009, http://www.abs.gov.au/websitedbs/a3121120.nsf/4a256353001af3ed4b2562bb00121564/ce88a10d17c46b56ca257610000a9364!OpenDocument Which of these is the explanatory variable for these results? |
Multiple Choice:
|
| 110) Problem #PRAD8YM "PRAD8YM - 117903 - Can the result fr..." |
|
Can the result from an observational study conclude the cause of certain relationships between an explanatory variable and a response variable? Source: N/A, "Statistics/Methods of Data Collection/Observational Studies", WikiBooks, May 23, 2010, http://en.wikibooks.org/wiki/Statistics/Methods_of_Data_Collection/Observational_Studies |
Multiple Choice:
|
Scaffold:
|
Scaffold:
|

Scaffold:
|
Scaffold:
|
Scaffold:
|
Scaffold:
|
| 111) Problem #PRAEACP "PRAEACP - 119238 - It is essential t..." |
|
It is essential that we approach and solve problems by using and interpreting data, not by giving "obvious" answers. Statistical significance is usually expressed in terms of a significance level which is a percentage, but no matter what that percentage is, significance does not equate to importance. Statistical significance implies that there is evidence of an association between two variables. ------------------------------------------
Note: A placebo is a "fake" pill that patients are given that has more of a psychological remedy than an actual physical remedy. Refer to the table above. An experimental study was conducted on a group of people to see whether Vitamin C helps prevent colds. Is the data reported statistically significant enough to conclude that Vitamin C plays a role in preventing colds? Source: http://www.abs.gov.au/websitedbs/a3121120.nsf/4a256353001af3ed4b2562bb00121564/b3cb0b453c0c4203ca25761700002c35!OpenDocument |
Multiple Choice:
|
|
Hints: |
|
|
| 112) Problem #PRAEDQB "PRAEDQB - 122451 - Analysis of this ..." |
|
Analysis of this result indicated that the difference between the placebo and Vitamin C was statistically significant. Statisticians can evaluate that a difference this large would arise by chance in 1% of studios of this size and design thus the result is statistically significant. ------------- If data is practically significant, this means that the information concluded from the data is enough to impact behavior. To understand this, let's look at the data table above. We could ask if the data in the table would be enough to convince people to take 1 gram of Vitamin C every day of their life. Would people necessarily change their behavior on the basis of these results? Source: N/A, "Understanding Statistics", Australian Bureau of Statistics, September 1, 2009, http://www.abs.gov.au/websitedbs/a3121120.nsf/4a256353001af3ed4b2562bb00121564/d513a9432adec195ca25761700002cfd!OpenDocument |
Multiple Choice:
|
| 113) Problem #PRAEBUA "PRAEBUA - 120652 - Let's make sure y..." |
|
Let's make sure you understand the difference between statistically significant and practically significant. Let's say a study was conducted which shows data between the number of hours of studying without the television on and with the television on. Analysis showed that the difference in the test scores are statistically significant. Does this mean that it is also practically significant, meaning people might start studying more instead? |
Multiple Choice:
|
| 114) Problem #PRAEC23 "PRAEC23 - 121823 - Now that you have..." |
|
A)
Now that you have learned four methods of data collection (census, sample survey, experimental survey, observational survey), let's make sure you know the difference between them. Which method of data collection gets results from an entire population? |
Multiple Choice:
|
|
B)
Which method of data collection gets results from a small group of people? |
Multiple Choice:
|
|
C)
Which method of data collection gets results from a group of people who have the freedom to choose the explanatory variable that yields their response variable? |
Multiple Choice:
|
|
Hints: |
|
Which method of data collection does this exemplify? |
|
D)
Which method of data collection gets results from a group of people who are assigned a certain explanatory variable to yield a response variable? |
Multiple Choice:
|
|
Hints: |
|
Which method of data collection does this exemplify? |
| 115) Problem #PRAEDPP "PRAEDPP - 122431 - In this as..." |
|
A)
In this assistment you will be taught how to make and conduct a survey. The purpose of a good survey is to understand and analyze the views of a certain segment of the population. Before making questions to ask people you need to fully analyze and understand the exact purpose of the survey. When the purpose of the survey is established then we need to identify the specific population we will focus on. When we have the people and the purpose then we have to make questions up that make for the fairest and least biased results. Sampling the population This is the hardest part of a survey. When sampling a population one needs to get results that are the closest to the truth and the least biased. Examples of biased samples. volunteer sample, where individuals have selected themselves to be included convenience sample, where individuals happen to be at the right time and place to suit the schedule of the researcher sampling frame---list of potential individuals to be sampled---does not match the population of interest How you should sample: simple random sample- list of everyone that the question pertains to. Even when using this, there will still be a volunteer response. Since individuals are not compelled to respond, often a relatively small subset take the trouble to participate. Still, this is the least biased way to conduct a survey, as you are giving everyone a chance to answer. |
Multiple Choice:
|
|
B)
When you need to find out how much the average American loves sports, on a scale of 1-10 how should you conduct the survey? |
Multiple Choice:
|
|
C)
What is the best why to survey people if you want to find out who will win the class election? |
Multiple Choice:
|
|
D)
Different sampling methods Simple Random Sampling is, as the name suggests, the simplest probability sampling plan. It is equivalent to "selecting names out of a hat", where each individual as the same chance of being selected. Cluster Sampling - This sampling technique is used when our population is naturally divided into groups (which we call clusters). Stratified Sampling - Stratified sampling is used when our population is naturally divided into sub-populations (which we call stratum, plural: starta). Ex. Suppose you would like to study the job satisfaction of hospital nurses in a certain city based on a sample. Besides taking a simple random sample, here are two additional ways to obtain such a sample 1. Suppose that the city is 10 hospitals. Choose one of the 10 hospitals at random and interview all the nurses in that hospital regarding their job satisfaction. This is an example cluster sampling where the hospitals are the clusters. 2. Choose a random sample of 50 nurses each of the 10 hospitals and interview these 50*10=500 regarding their job satisfaction. This is an example of stratified sampling where each hospital is a stratum. Which way of sampling is best if you were survey students at Boston Latin school and how much they like school lunch? |
Multiple Choice:
|
|
E)
If you are interested in finding out the approval rating of a president, should you just ask the people in Massachusetts or should you ask people from all 50 states? |
Multiple Choice:
|
|
F)
What sampling method is best when we are trying to figure out how much students like their high schools in New York? |
Multiple Choice:
|
|
G)
When asking the Public different Survey questions then the questions have to be written in an unbiased way. Examples of biased questions With Obama's terrible track record in the senate, do you think he will make a good president? Do you want biased questions in your Survey? |
Multiple Choice:
|
|
H)
When asking people if they will vote for Obama, what is the best way of asking the question? |
Multiple Choice:
|
|
I)
When you are conducting a good Survey you cannot let the people you are asking know your opinion or the people's opinions will sway. If you are asking people about global warming and if they believe in it, you cannot say that you believe that the earth will be destroyed by global warming. What is the best Survey question if you are interested in whether or not people believe in Global warming? |
Multiple Choice:
|
|
J)
If you are interested in finding out the number of people who have diabetes in boston, what is the best way to ask the questions? |
Multiple Choice:
|
|
K)
Where is the best place to ask the previous question? |
Multiple Choice:
|
|
L)
What is a good amount of people to ask for a good survey? |
Multiple Choice:
|
|
M)
When we cunduct a survey we always have a purpose. If we were trying to find out the age that most people develop diabetes we need to take the mean and median of the data Mean- is the average Median- is the middle term ages- 23,34,37,64,65,66,66,67,70 What is the mean and median |
Multiple Choice:
|
|
N)
Now we decided to weight of the people in our diabetes survey. No diabetes(weight lbs) - 134, 140, 150, 160, 170, 168 Yes diabetes(weight lbs) - 200, 210, 290, 300, 250 What is the Mean weight of a person who has diabetes? |
Algebraic Expression:
|
|
O)
What has a stronger correlation persons weight and diabetes or Persons age and diabetes? yes diabetes ages- 23,34,37,64,65,66,66,67,70 no diabetes ages - 23, 45, 67, 68, 26,29, 80 No diabetes(weight lbs) - 134, 140, 150, 160, 170, 168 Yes diabetes(weight lbs) - 200, 210, 290, 300, 250 |
Multiple Choice:
|
|
P)
volunteer sample, where individuals have selected themselves to be included convenience sample, where individuals happen to be at the right time and place to suit the schedule of the researcher sampling frame---list of potential individuals to be sampled---does not match the population of interest give an example of each |
|
Ungraded Open Response: |
|
Q)
Sources: Open Learning Initiative, "Sampling," Open Learning Initiative, October 27, 2010 https://oli.web.cmu.edu/jcourse/workbook/activity/page?context=90de571d80020ca60104b2620b3f3e00&view=frameset Australian Bureau of Statistics, "Module 1: Producing Data," Australian Bureau of Statistics, October 28, 2010 http://www.abs.gov.au/websitedbs/a3121120.nsf/4a256353001af3ed4b2562bb00121564/a5a5e246faa67167ca2575e1001ce4fb!OpenDocument |
|
Ungraded Open Response: |
| 116) Problem #PRAEBER "PRAEBER - 120263 - Topic #16: Simple Random Sample (SRS)" |
|
A)
Type in the following code: ##Start of code sample(1:30, 5, replace=F) ##End of Code This will allow you to take an SRS from a population of 30, with the sample size being 5, without replacing any numbers so that you might choose a number twice. This SRS is chosen fairly because the numbers are randomly generated and are removed from the lottery. Do you understand how lottery works? |
Multiple Choice:
|
Scaffold:
|
|
B)
Use the labeled table from the review website found here: https://sites.google.com/site/apstats16/home/srs Using your textbook, reference table B's value 113 and find the 5 clubs that will be shown on BLSTV this week. |
Multiple Choice:
|
Scaffold:
|
| 117) Problem #PRAD8XC "PRAD8XC - 117864 - Topic #16: Sources of Bias" |
|
A)
The Prudential Center decided to survey the shopping habits of its consumers. Due to budget restraints, interviews were conducted only by person within the plaza. Is this sample survey biased? |
Multiple Choice:
|
Scaffold:
|
Scaffold:
|
|
B)
Boston Latin School students of a health class were tasked to survey their neighbors about smoking policy. The question is posed as follows: A recent survey has shown that many of the cases of lung cancer this past year were caused by the frequent first-hand smoking habits of doctors and business persons outside of their respective offices and the resulting second-hand smoke. We are concerned for the health of our community and wish to know your stance on what should be done. Do you think that these people should be smoking so close to the building of their work? Is there a problem to how this question was posed? |
Multiple Choice:
|
Scaffold:
|
| 118) Problem #PRAD867 "PRAD867 - 118107 - Bias is everywher..." |
|
A)
Bias is everywhere in our daily lives. It is inevitable. It is unavoidable. It is part of human nature. You must succumb to it. There is no escape. Have you ever experienced bias in your life before? |
Multiple Choice:
|
|
B)
The bias you've experienced in your life is most likely different from bias as we know it in statistics. In statistics, a sampling method is BIASED if it systematically favors certain outcomes. Would you consider propaganda a form of bias? |
Multiple Choice:
|
|
C)
Let's say for example you want to conduct a survey about the average number of hours people spend on computers. You survey people at a local daycare center. What would be a source of bias in this survey? |
Multiple Choice:
|
|
D)
An advertisement in the newspaper USA Today once asked the readers, "Should handgun control be tighter? If yes, call 617-504-9511, if no, call 857-540-6142. All calls will be charged 50 cents." Why is this survey most certainly biased? |
Multiple Choice:
|
|
E)
Now that you have a better idea of what type of data would be considered biased, you should know there are many different kinds of bias: Selection bias is where individuals or groups are more likely to take part in a research or a survey than others, thus resulting in biased data (selection bias is also known as Berksonian bias). Spectrum bias is where the surveyed group is biased to begin with. Sampling bias occurs when some members of the population being surveyed are less likely to be included than others. What type of bias is the follow scenario? A writer for a current scientific publication wants to interview teenagers about illegal drug use at a local high school. However, because this survey is conducted at a high school, it does not include the teenagers that are high school drop outs or teenagers that are homeschooled. |
Multiple Choice:
|
| F) |
|
Algebraic Expression: |
| 119) Problem #PRAEC25 "PRAEC25 - 121825 - Now that you know..." |
|
A)
Now that you know about the various types of statistical bias, let's take a look at how one would sample something for surveys. Are you excited? |
Multiple Choice:
|
|
B)
There are two types of groups of individuals that we work with when we sample for data. A population is the entire group of individuals we want information about. A sample is only a part of the population that we examine to gather information about the whole. For example, say you want to gather information about how happy college students are in the United States. You go to a local college and survey the students there to represent all U.S. college students. Did you just take a sample of college students, or did you survey the entire population of college students? |
Multiple Choice:
|
|
C)
Now let's say you want to find out what the minimum wage for all of the farmers in China is. You go to China and interview every single farmer in the People's Republic. Did you just interview a sample of farmers or the entire population? |
Multiple Choice:
|
|
D)
Now that you know the difference between a sample and a population, let's take a look at some actual sampling methods... A sampling method refers to the process used to chooes the sample from the population. Poor sampling methods can lead to misleading conclusions. For example, in the state of Alabama, a local news station casts a poll to see which candidate the people will vote for in the upcoming race in a dominantly Democratic part of the state. Is this an example of a poor sampling method? |
Multiple Choice:
|
|
E)
Now consider the following scenario: A science journal wants to know how much fast food America consumes per month. A group of statisticians from the journal contacts fast food restaurants around the nation and asks how much fast food they sell within a month. Is this an example of a good sampling method? |
Multiple Choice:
|
|
F)
Another type of a sampling method is called voluntary response sample. This kind of sampling consists only of people who decide to respone to the survey. This kind of sampling method is inherently biased, as only people who want to respond, will. Another type is called convenience sampling. This kind of sampling only chooses individuals that are easy to reach to interview or survey. Now let's consider the following situation: You work for a marketing agency and are asked by your boss to find out what makes people in your city buy certain kinds of MP3 players. You then interview people only in your neighborhood, going from door to door. Because you live in a very high-end and rich neighborhood, you conclude that people buy only the most expensive kinds of MP3 players. What kind of poor sampling method is this? |
Multiple Choice:
|
|
G)
Now, voluntary response sampling and convenience sampling are both inherently flawed because in one, the people choose to respond to the survey and in the other, the interviewer chooses. The only way to remedy this is by using a simple random sample. A simple random sample consists of individuals from a population that are chosen in such a way to ensure that everyone has an equal chance to be selected. What are some ways do you think you can take a simple random sample? |
Multiple Choice:
|
|
H)
Say you won 5 free tickets to Canobie Lake Park, and you didn't know which of your friends to choose without hurting their feelings. You make a list of all of your closest friends and want make sure each one gets an equal chance to get selected. You close your eyes and run your finger over each name and then stop randomly. Here is your list: Dan, Ian, Kevin, Caitlyn, Malcolm, Dan, Mike, Eric. Would you be taking a simple random sample? |
Multiple Choice:
|
|
I)
Now, the last type of good sampling methods we'll cover today (finally!) is called stratified random sampling. This involves dividing the population into groups of similar individuals, called strata. Then choose a separate simple random sample in each stratum and combine these to form a full sample. Let's say you want to know what political affliation people in Massachusetts is. First, you would divide the population of Massachusetts into similar political parties (Democratic, Republican, Green, Independent), and then you would take a simple random sample of each party, and then combine them to get a better picture of the political standing in Massachusetts is. Is this a good example of stratified random sampling? |
Multiple Choice:
|
|
J)
That was last, but certainly not least! Did you find our Assistment helpful? |
|
Ungraded Open Response: |
| 120) Problem #PRAEDSW "PRAEDSW - 119626 - Explanation" |
|
Design of experiments refers of the blueprint for planning a study or experiment, performing the data collection protocol and controlling the study parameters for accuracy and consistency. Data, or information, is typically collected in regard to a specific process or phenomenon being studied to investigate the effects of some controlled variables (independent variables or predictors) on other observed measurements (responses or dependent variables). Did you learn something new? "AP Statistics Curriculum 2007 IntroDesign." Statistics Online Computational Resource. 28 June 2010. http://wiki.stat.ucla.edu/socr/index.php/AP_Statistics_Curriculum_2007_IntroDesign |
Multiple Choice:
|
| 121) Problem #PRAECYZ "PRAECYZ - Explanatory and Response Variables" |
There are two types of variables involved in experimenting with data.
In this case, the explanatory variable would be the hours of preparation because it causes a change in the response variable. The response variable would be the student test score because differences can be observed in them. For example, if a student spends two hours studying, they might receive a higher test score than one that only spends 20 minutes studying. The explanatory variable changes the response variable. Do you understand it? |
Multiple Choice:
|
| 122) Problem #PRAD9DK "PRAD9DK - 118305 - Practice problems using explanatory and response" |
|
A)
Scientists are conducting an experiment to test the correlation between a bird's speed with its wing span. Which of these two variables is the explanatory variable (independent variable)? |
Multiple Choice:
|
Scaffold:
|
|
B)
Some students are studying the affects of height and a person's weight. They took 50 samples and found a relationship in the data. The taller a person is, the more they weigh. Vice versa, a shorter person with have a smaller weight. If the weight changes accordingly to the height, then what kind of variable is it? |
Multiple Choice:
|
|
Hints: |
|
|
|
C)
The amount of cigarettes someone smokes can change their life span. A group of researchers found that people who smoke a lot of cigarettes will have a shorter life span than people who don't smoke or smoke very little. What is the explanatory or the independent variable in this situation? |
Multiple Choice:
|
|
Hints: |
|
|
| 123) Problem #PRAEDSN "PRAEDSN - Control Group" |
|
In an experiment, there are two groups: the experimental group and the control group. The control group and the experimental group are almost identical except the experimental group is affected by a variable that the control group is not. This means that the control group doesn't receive any experimental treatment. The control group can be used to observe how a variable changes the experimental group. Are you ready to move on to the practice problems? |
Multiple Choice:
|
|
Hints: |
|
EXAMPLE: You're testing out how to improve your test scores through different methods of preparation for a test. You try doing it fours different ways and each way is one hour. The first way is not preparing for the test at all. The second way is reading the book. The third way is studying only from your notes. The fourth way is a combination of reading from the book and studying from your notes. The control group is the first way because you don't apply any method of preparing for the test to it. Thus it doesn't get the experimental treatment. |
| 124) Problem #PRAD9MC "PRAD9MC - 118515 - Control groups practice" |
|
A)
You are looking at the effects of nitrogen on plants. You have two groups: one group has a high level of nitrogen and the other has a normal level of nitrogen. Which is the control group? |
Multiple Choice:
|
|
Hints: |
|
|
|
B)
Scientists are conducting an experiment to observe the effects of a new drug (Drug A) for depression. One group was given the given Drug A, one with another drug (Drug B) and one without the drug. Which group is the control group? |
Multiple Choice:
|
|
C)
A farmer is trying to determine what type of feed he should give his chickens in order to have them at their optimal weight. He split up his chicken into four groups. Group 1 is given a corn based feed. Group 2 is given a fish based feed. Group 3 is given a grain based feed. Group 4 is given their regular mixed type feed. Which of the following is the control group? |
Multiple Choice:
|
Scaffold:
|
Scaffold:
|
| 125) Problem #PRAEAWG "PRAEAWG - 119759 - A confounding var..." |
|
A)
A confounding variable is another variable whose effect on the response variable cannot be separated from the explanatory variable under study. Look at the table below and identify the anesthetic that seems most dangerous. Death Rates Associated with Various Anesthetics
"Module 1: Producing Data." Australian Bureau of Statistics. 13 November 2009. http://www.abs.gov.au/websitedbs/a3121120.nsf/4a256353001af3ed4b2562bb00121564/ce88a10d17c46b56ca257610000a9364!OpenDocument |
Multiple Choice:
|
|
B)
If you selected Cyclopropane, you are right. It does SEEM to be the most dangerous anesthetic as it is associated with the highest death rate. However, understanding the context in which these dat were generated allows you to identify confounding variables and will allow you to make a more reasoned interpretation of hte data. In fact, the apparently higher death rate for people who were given Cyclopropane can be explain if you consider that Cyclopropane tended to be used for risky operations that had a higher death rate anyway. |
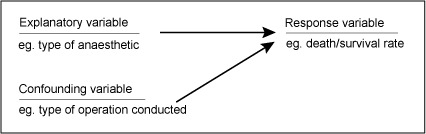
Multiple Choice:
|
Scaffold:
|
| 126) Problem #PRAEDQ5 "PRAEDQ5 - Treatment" |
|
A)
When a medical researcher is testing out a new drug, one very important factor is to determine how much of the drug should be administered for the best results. If he has 4 volunteers to test the drug, he will give each of them a different Treatment. This means that each of them would receive a diferent amount of the drug. A Treatment is a unique condition applied to experimental units (such as an individual). An Experimental Unit is the individual that an experiment would be conducted upon. In an experiment, you want to ind out how different variables affect the experimental units, so you will need to create different treatments to observe the differences. |
Multiple Choice:
|
|
B)
Here's an example: A doctor has just created a drug called Simoneaucine to help peoples memory. He needs to find out how many milligrams of Simoneaucine a patient should take for the effects to work properly. He has 5 volunteers to experiment with. He chooses to give each of them a different dosage and observe which dosage produces the intended results best. Each patient in this experiment will be considered an Experimental Unit because the experiment is being conducted on them. Each of them will receive a unique Treatment. Each will take a different dosage of Simoneaucine. |
Multiple Choice:
|
|
C)
Try one out or yourself. Identify the Experimental Units and the Treatments in the following scenario. Mr. Simoneau, a high school statistics teacher is trying to find out which types of questions on a test will confuse the students most. He has 3 types of questions to decide between; Multiple Choice, Open response, and Short answer. He has 3 classes in his schedule to give the test to. He gives each of the 3 classes a test consisting of only one type of question each. He observes which type of question produces the lowest average grades in the class for the test. (Choose the best answer in this order: Experimental Unit, Treatment) |
Multiple Choice:
|
Scaffold:
|
Scaffold:
|
| 127) Problem #PRAEDSX "PRAEDSX - Placebo Effect" |
|
Confounding variables can be very important in clinical trials where a new drug or procedure is being tested. Let's say a doctor gives a patient a new drug in tablet form and the patient gets better. How can you tell whether it was 1) the attention that was given to the patient as the drug was administered, or 2) the drug itself that caused the improvement? Many patients respond positively to any treatment, even when they are given a placebo, i.e. a dummy medication. In other words, it is the process of being treated, not the action of the drug, which produces patient improvement. As a result, it becomes important to separate the drug (explanatory variable) from the treatment (confounding variable). An improvement in a person's health that occurs when they are given a dummy medication is called the placebo effect. Do you understand it? "Module 1: Producing Data." Australian Bureau of Statistics. 13 November 2009. http://www.abs.gov.au/websitedbs/a3121120.nsf/4a256353001af3ed4b2562bb00121564/ce88a10d17c46b56ca257610000a9364!OpenDocument |
Multiple Choice:
|
| 128) Problem #PRAEDR9 "PRAEDR9 - practice 1" |
|
A)
I dentify the Explanatory variable, Reference variable, Experimental unites, and the Treatments in the following scenario. A banana packaging company is conducting an experiment to see what temperature their trucks should transport their bananas with to have the bananas last the longest. They own 4 trucks and decide to send them each out full of bananas at different temperatures. The trucks are sent with temperatures of 10, 15, 20, and 25 degrees Celsius. What is the Explanatory Variable? |
Multiple Choice:
|
|
B)
What is the Reference Variable? |
Multiple Choice:
|
|
C)
What is the explanatory unit? |
Multiple Choice:
|
|
D)
What is the treatment? |
Multiple Choice:
|
| 129) Problem #PRAD8YX "PRAD8YX - 117913 - Read the followin..." |
|
Read the following Scenario 1: A boy named Rasheem, had a pet turtle that he found deep in the woods. One day his pet turtle showed unusual signs. Rasheem had an idea. He thought a possible reason for this was the food that he was feeding his pet turtle. He decided to conduct an experiment. He went back to the woods where he found his pet turtle. He took 20 more turtles, he isolated all 20 of them from the rest of the turtles. He marked an X on the turtles that he used as a control-- the turtles that are going to eat the food normally eaten in the woods, while the experimental group ate the food that Rasheem provided. He then isolated the control group and the eperimental groups. Each day, he went back to the woods to observe them. He recorded the affects of the experimental group. After a couple of days, the experimental group showed the exact signs as his pet turtle. Rasheem concluded that the food was the problem. Scenario 2: A boy named Rasheem, had a pet turtle that he found deep in the woods. One day his pet turtle showed unusual signs. Rasheem had an idea. He thought a possible reason for this was the food that he was feeding his pet turtle. He decided to conduct an experiment. He went back to the woods where he found his pet turtle. He took 2 more turtles, he isolated all 2 of them from the rest of the turtles. He marked an X on the turtle that he used as a control-- the turtle that are going to eat the food normally eaten in the woods, while the experimental group ate the food that Rasheem provided. Each day, he went back to the woods to observe them. After the first day, there was no signs. Rasheem concluded that it was just his pet turtle. Which scenario is the best example of a well conducted example and why was the wrong one wrong? |
Check All That Apply:
|
| 130) Problem #PRAD8Y2 "PRAD8Y2 - 117916 - If a team of biol..." |
|
If a team of biologists from Harvard Medical School wanted to created a study to show the effects of sleep deprivation of teenagers with low test scores, they would design a test with the least number of factors. The test would need to be replicated throughout the world by various medical institutions and so in order to create a statistically accurate study what would be the best candidates for the study? |
Check All That Apply:
|
| 131) Problem #PRAEC3H "PRAEC3H - 121837 - A teacher wanted ..." |
|
A teacher wanted to know if students actually learned the material taught in class. To test this, she decided to give them all a pop quiz. She wanted to know if there was any difference between taking a multiple choice test or taking an open-response test. Which group will have the highest test results. Instead of giving them all the same formatted test, she decided to give them a choice. They can choose between taking a multiple choice test or taking an open- response test. 15 students chose to take the multiple choice test and 10 chose to take the open-response test. Because the teacher let them choose which type of test to take, the statistical data results were similar. What happened? |
Multiple Choice:
|
|
Hints: |
|
|
| 132) Problem #PRAEACJ "PRAEACJ - 119234 - A single bli..." |
|
A single blind study is a way of eliminating any bias of product of the experiment itself. Coca-Cola designed a single blind study to test their Coke Zero product to their original Coca-Cola product. How should they display the two products to the subjects or the people testing the two products? |
Multiple Choice:
|
| 133) Problem #PRAEDQP "PRAEDQP - 122462 - Is a random sampl..." |
|
Is a random sample biased or unbiased? |
Multiple Choice:
|
| 134) Problem #PRAD87P "PRAD87P - 118122 - In order to have ..." |
|
In order to have an accurate study what ratio of the test group should be the control group? |
Multiple Choice:
|
| 135) Problem #PRAEC3G "PRAEC3G - 121836 - What are the sour..." |
|
What are the sources of bias? |
Check All That Apply:
|
|
Hints: |
|
|
| 136) Problem #PRAEDM7 "PRAEDM7 - 122385 - There correlation..." |
|
There correlation between the sales of winter clothes and the deaths from falling through ice and drowning. But one can not infer that winter clothes shopping causes drowning. What factor is missing from this situation that would explain the relationship between these two instances? |
Multiple Choice:
|
| 137) Problem #PRAEAC3 "PRAEAC3 - 119250 - A boy named..." |
|
A boy named Rasheem, had a pet turtle that he found deep in the woods. One day his pet turtle showed unusual signs. Rasheem had an idea. He thought a possible reason for this was the food that he was feeding his pet turtle- processed turtle food. He decided to conduct an experiment. He went back to the woods where he found his pet turtle. He took 20 more turtles, he isolated all 20 of them from the rest of the turtles. He marked an X on the turtles that he used as a control-- the turtles that are going to eat the food normally eaten in the woods, while the experimental group ate the food that Rasheem provided. He then isolated the control group and the eperimental groups. Each day, he went back to the woods to observe them. He recorded the affects of the experimental group. After a couple of days, the experimental group showed the exact signs as his pet turtle. Rasheem concluded that the food was the problem. What is the treatment of the experimental group? |
Multiple Choice:
|
|
Hints: |
|
|
| 138) Problem #PRAEC3C "PRAEC3C - 121832 - In our ..." |
|
In our intellectual society, advancements in science and medicine occur quite frequently. Not all of the science is viable. Some results are sometimes sloppy and full of human error. The important difference between "Sound" science and "Junk" science is... |
Multiple Choice:
|
|
Hints: |
|
|
| 139) Problem #PRAEACU "PRAEACU - 119243 - An experimental u..." |
|
An experimental unit is any group, thing, or object that takes part in an experiment. Knowing this, what is the answer to the following question? Hospital floors are usually covered by bare tiles. Carpets would cut down on noise but might be more likely to harbor germs. To study this possibility, investigators randomly assigned 8 of 16 available hospital rooms to have carpet installed. The others were left bare. Later, air from each room was pumped over a dish of agar. The dish was incubated for a fixed period, and the number of bacteria colonies were counted. Select the appropriate statistical term for the 16 hospital rooms. "EBook Problems EDA IntroDesign," last modified on 26 October 2009, accessed 26 October 2010, http://wiki.stat.ucla.edu/socr/index.php/EBook_Problems_EDA_IntroDesign |
Multiple Choice:
|
| 140) Problem #PRAEC22 "PRAEC22 - 121822 - Jennifer particip..." |
|
Jennifer participated in a study where she had to take two pills each day. The pills were part of a study conducted by John Hopkins University for the treatment chronic migraines. Jennifer wasn't told whether she was part of the control group or the experimental group. After two weeks of taking the pills she told researchers at the John Hopkins that she noticed a change in her migraine pain. She noted that they were now less painful than before. However she was not part of the experimental group, she was part of the control group. What kind of effect did she experience? |
Multiple Choice:
|
|
Hints: |
|
|
| 141) Problem #PRAD87Q "PRAD87Q - 118123 - The word random e..." |
|
A)
The word random explains it all. In order for something to be random, there can't be any bias or any choosing. What are some techniques of random assignments (an experimental technique for assigning subjects to different treatments or groups). |
Check All That Apply:
|
| B) |
|
Algebraic Expression: |
| 142) Problem #PRAEACY "PRAEACY - 119247 - How would a doubl..." |
|
How would a double blind experiment be performed for a product, by whom? |
Multiple Choice:
|
| 143) Problem #PRAEDQ2 "PRAEDQ2 - 122473 - 500 people signed..." |
|
500 people signed up to take part in Josh's sleep deprived study. Josh chose the first 100 people to be in it. He randomly assigned 50 people to be apart of his control group and the remaining 50 to be apart of his experimental group. What was Josh's method of splitting the people into two groups called? |
Exact Match (case sensitive):
|
|
Hints: |
|
|
| 144) Problem #PRAEACX "PRAEACX - 119246 - A double blind st..." |
|
A double blind study is a way to eliminate both bias in the experimentation and also the experimenter. In what ways can an experimenter be bias during a study testing the public's preference of Pepsi or Coca-Cola? |
Check All That Apply:
|
| 145) Problem #PRAEAC5 "PRAEAC5 - 119252 - Doctors at the UC..." |
|
Doctors at the UCLA Hospital are worried about some of the side effects of a drug used to treat cancer when that drug is prescribed in large amounts. 60 volunteers are randomly split into three groups of 20; the first group doesn't take the drug, the second group takes a low dosage of the drug, and the third group takes a high dosage of the drug. How many treatments are there in this experiment? "EBook Problems EDA IntroDesign," last modified on 26 October 2009, accessed 26 October 2010, http://wiki.stat.ucla.edu/socr/index.php/EBook_Problems_EDA_IntroDesign |
Multiple Choice:
|
| 146) Problem #PRAD87T "PRAD87T - 118126 - If doctors want t..." |
|
If doctors want to conduct an experiment to determine whether Prograf or Cyclosporin is more effective as an immunosuppressant, in a sample size of 300, how many subjects would be assigned to each? Carnegie Mellon, Open Learning Initiative, Statistics, October 26, 2010, https://oli.web.cmu.edu/jcourse/workbook/activity/page?context=90de572a80020ca6013b1983f8562ffd&view=frameset |
Check All That Apply:
|
| 147) Problem #PRAD87D "PRAD87D - 118113 - A new hair produc..." |
|
A new hair product promises to cure frizzy hair, and backs up this statement with tests they collected and analyzed over a period of 2 years. They take a group of 550 males and females and over the course of two years watch the group for changes to their hair. What is the possible flaw to this study? |
Multiple Choice:
|
| 148) Problem #PRAEDS7 "PRAEDS7 - Factors" |
|
What is a factor? |
Multiple Choice:
|
|
Hints: |
|
|
| 149) Problem #PRAEDS6 "PRAEDS6 - Control" |
|
What is the purpose of a control? |
Multiple Choice:
|
| 150) Problem #PRAEDS8 "PRAEDS8 - 122541 - Problem #122541" |
Algebraic Expression:
|
| 151) Problem #PRAEDTA "PRAEDTA - Double Blidn" |
|
What is one issue with double blind experiments? |
Multiple Choice:
|
| 152) Problem #PRAEDS2 "PRAEDS2 - Randomization Question" |
|
Given the random digits table i the book, when asked for the numbers for an experiment with labels 01 to 99 who would be picked when looking at line fifty of the random digits table? |
Multiple Choice:
|
Scaffold:
|
Scaffold:
|
Scaffold:
|
Scaffold:
|
| 153) Problem #PRAEDMQ "PRAEDMQ - Question 1" |
|
Before we delve into the world of experimental design, here are some helpful basics to know about the statistical design of experiments: Control the effects of lurking/external variables on the response by comparing two or more treatments. Randomize by using chance to assign experimental units to treatments. Replicate the same treatment on many experimental units to reduce variation in results. Do you understand these basic principles? If not, reread each point. |
Multiple Choice:
|
| 154) Problem #PRAEDMV "PRAEDMV - Question 2" |
|
Now let's delve into the world of experimental design itself! Here are some more basics: The individuals that are being tested are called experimental units. When humans are the experimental units, they are referred to as subjects. In the following problem, check all of the experimental units that are subjects: |
Check All That Apply:
|
| 155) Problem #PRAEDMZ "PRAEDMZ - Question 3" |
|
With the experimental units out of the way, let's move onto the experiment! The experimental conditions that affect the units are called factors. A combination of factors form treatments. For example: Scientists are conducting a study on what factors will cause a cow to grow larger. They propose that a cow's diet and the amount of exercise are factors. They carry out the experiment with 500 cows being fed grass or grain diets. They also are subjected to either 40 minutes of exercise or 60 minutes of exercise. So cows are divided into FOUR treatments with TWO factors. Refer to the table below:
If you understand, click yes. Otherwise go back and reread! |
Multiple Choice:
|
| 156) Problem #PRAEDNC "PRAEDNC - Question 4" |
Teachers are trying to enhance the performance of their students. They conduct a study with 120 volunteer students. They ask the students to change sleeping habits to 7, 8, and 9 hours of sleep. Students are also asked to change their diet to eating fish or not eating fish. How many factors and treatments are there?
|
Multiple Choice:
|
| 157) Problem #PRAEDNP "PRAEDNP - Question 5" |
|
Good job on getting this far! Now that we're familiar with the terminology of experimental design, we are going to move onto the types of design. The simplest experimental design is the completely randomized design. Exactly like what we have been doing so far, all the experimental units are divided evenly at RANDOM to each treatment (there is no specific assignment of units). To determine which delivery company delivers packages faster, 600 packages were distributed among 3 delivery companies evenly.
|
Multiple Choice:
|
| 158) Problem #PRAEDNX "PRAEDNX - Question 6" |
Two types of fertilizer are being tested to see which is better at helping plant growth. 100 flower bulbs receive each fertilizer. 25 flower bulbs receive fertilizer A while 75 flower bulbs receive fertilizer B. Is this a completely randomized design?
|
Multiple Choice:
|
| 159) Problem #PRAEDNY "PRAEDNY - Question 7" |
|
Moving on! Matched pairs design is a more elaborate randomized design and compares only two treatments. The subjects are PAIRED to be as close as possible to each other. For example: a piece of cloth is torn into two pieces. Each piece of cloth is then used to test the strength of two different detergents. This eliminates the external variable of the type of cloth used. 700 subjects with mental illnesses are subjected to a study. They undergo either a psychological therapy session or medical treatment. The subjects are paired based on age and gender. Is this an example of a matched pairs design? |
Multiple Choice:
|
| 160) Problem #PRAEDN7 "PRAEDN7 - Question 8" |
|
Matched pairs design does not only pair similar experimental units, but can also have each subject receive both treatments. Referring back to the previous problem, a subject can receive both the medical treatment and the psychological therapy to determine the effect of both treatments on one subject rather than have one subject of a pair undergo each treatment. Vegan scientists are proposing that vegetables may have an effect on brainpower. They assert that three vegetables in particular (broccoli, carrots, and brussel sprouts) have the ability to bolster a student's thinking power. 100 students each took 3 standardized tests, eating one of the specific vegetables before each test. The scores of the test were recorded along with the type of vegetable eaten. Is this a matched pairs design? |
Multiple Choice:
|
| 161) Problem #PRAEDPA "PRAEDPA - Question 9" |
|
With completely randomized design and matched pairs design out of the way, the last experimental design to discuss is block design. In a block design, the experimental units are divided into groups called blocks. Then the experimental units in each block are allocated to a random treatment. For example: Milk is being tested for expiration date and taste. There are 200 milk samples. Half of milk comes from cows and half of the milk comes from goats. The experimental unit, the milk, is blocked into the subgroup of either cow or goat milk. Physical therapists are conducting a study on runners depending on the amount of stretching they do. Runners are asked to stretch for 10, 15, and 20 minutes before a race to determine stretching's effectiveness. Physical therapists want to divide the groups into blocks to remove any other external variables. Check all of the following that are acceptable blocks: |
Check All That Apply:
|
| 162) Problem #PRAEDPG "PRAEDPG - Question 10" |
|
There is an SAT test coming up. To determine whether studying earlier before a test can improve results, 400 students are asked to study two months prior to the exam and to study two weeks prior to the exam. The students were divided equally between both groups. What type of experimental design is this? How many treatments are there? |
Multiple Choice:
|
| 163) Problem #PRAEDPH "PRAEDPH - Question 11" |
|
There is a study that indicates identical twins think alike. 100 pairs of twins were gathered. The twins were separated into different rooms. The same ten question survey was administered to all the twins and the results were compared to see if they had the same answers. What type of design is this? |
Multiple Choice:
|
| 164) Problem #PRAEDPJ "PRAEDPJ - Question 12" |
|
Here's a wrap up question about what you learned! Good job for completing the assistment! What did you learn about experimental design? What are the basics of experimental design? What are the individuals referred to? The experimental conditions? What are the three types of experimental design? |
|
Ungraded Open Response: |
| 165) Problem #PRAD8X9 "PRAD8X9 - 117892 - Romano's Industri..." |
|
Romano's Industries, a pharmaceutical company, has developed an experimental new extreme conditioning drug for the army. 1000 miltary volunteers are available. Each volunteer will be given a dose and have their physical performance tested. Why should Romano's not simply administer the new drug as the first step and record the volunteer's test results? |
Ungraded Open Response:
|
|
Hints: |
|
|
|
|
| 166) Problem #PRAEC3A "PRAEC3A - 121830 - Why should statis..." |
|
Why should statisticians rely on chance to make an assignment or allocation of test subjects to the control or test group? |
Ungraded Open Response:
|
|
Hints: |
|
|
| 167) Problem #PRAD8ZD "PRAD8ZD - 117927 - If John, a scient..." |
|
If John, a scientist, is conducting an experiment on rats' diets, then which of the following data sets would be the best to use for his experiment if he is only changing the variable of different diets among different groups of rats? Note: John desires as unbiased a data set as he can get from his choice of the following different data sets. |
Multiple Choice:
|
Scaffold:
|
Scaffold:
|
| 168) Problem #PRAD87S "PRAD87S - 118125 - AnimaEcho has cre..." |
|
AnimaEcho has created a new dog food formula. They want to test whether or not it tasted better than their previous Athion brand of dog food. There are 250 dogs of many different breeds available to act as test subjects. How should the dogs be distributed to the different groups? |
Ungraded Open Response:
|
Scaffold:
|
Scaffold:
|
| 169) Problem #PRAEDMP "PRAEDMP - 122369 - Matched pairs des..." |
|
Matched pairs design compares two experiments by... |
Multiple Choice:
|
| 170) Problem #PRAEACT "PRAEACT - 119242 - Machinecle Cubix,..." |
|
Machinecle Cubix, a pharmaceutical company with an emphasis on fitness, has developed an new energy drink for marathon runners that is claimed to significantly boost one's endurance. 3000 volunteers are available to act as test subjects to test this claim. Why should the company not simply let all the runners run at once, record their running distance, and redo it after they are given an appropriate amount of energy drink and rest? Assume that it is physically and legally possible for that many runners to run on the road at the same time. |
Ungraded Open Response:
|
|
Hints: |
|
|
|
|
| 171) Problem #PRAEACZ "PRAEACZ - 119248 - If a new Televisi..." |
|
If a new Television Company Flerovane wants to test the side effects on customers watching their Tv for extended durations and their researchers have defined the experiment as the side effects from watching their Standard Definition Tv for an extended duration compared against the side effects from watching their High Definition Tv for an extended duration and they want as unbiased a data set that they can get, which of the following data sets is most appropriate for their experiment. |
Multiple Choice:
|
|
Hints: |
|
|
|
|
|
|
|
|
| 172) Problem #PRAEC29 "PRAEC29 - 121829 - If Gori's Utiliti..." |
|
If Gori's Utilities is developing a new program for phones that allows the phones to listen to music stored on their computer and Gori wants as unbiased a data set as she can get, which of the following data sets is the most unbiased for her to use if she knows that the new program will work differently on different types of phones as determined by her research team? |
Multiple Choice:
|
|
Hints: |
|
|
| 173) Problem #PRAEDNM "PRAEDNM - 122398 - Ronald's Factory ..." |
|
A)
Ronald's Factory is testing out a new conveyor belt that system will allow his workers to take their breaks at different times and the project was successful. Now Ronald wants to implicate this experimental conveyor belt system in all of the factories in his city. But, many of these factories are different and the way Ronald's new conveyor belt system will work in each one will be a little different. Ronald unfortunately was unable to hire a research team that would investigate all of the factories for information on how different his results would be so now he is only able to do the experiment itself. With this information which of the following data sets should Ronald choose? |
Multiple Choice:
|
|
Hints: |
|
|
|
B)
Design an experiment from the situation above if Ronald wants to test his new conveyor belt system for the Night Shift and the Day Shift (Same Participants) between Very Old Factores, Somewhat Old Factories, and New Factories considering the factories in question supplied the funds to research their factories and they found that there were significant differences between the 3 types of factories and Night and Day Shift. |
|
Ungraded Open Response: |
|
Hints: |
|
|
|
|
|
|
| 174) Problem #PRAEDMT "PRAEDMT - 122373 - Block design seek..." |
|
Block design seeks to divide the test subjects into blocks. What are blocks? |
Multiple Choice:
|
| 175) Problem #PRAEDMM "PRAEDMM - 122367 - Scientists have d..." |
|
Scientists have developed a new medication that is claimed to cure lung cancer. How should scientists divide the test subjects into groups if they know that one of the following paired groups of factors will have a significant difference? |
Multiple Choice:
|
| 176) Problem #PRAEC2Z "PRAEC2Z - 121821 - A gym teacher wan..." |
|
A gym teacher wants to sample his students upper body strength by making them a endurance test that will measure the amount of push-ups that each student can perform before tiring out. Before the experiment is started, what should the teacher do to the class so that some of the interfering variables will be eliminated? |
Ungraded Open Response:
|
|
Hints: |
|
|
| 177) Problem #PRAEDNQ "PRAEDNQ - 122401 - Gingy is experime..." |
|
Gingy is experimenting with chemicals in a lab and he discovers that a prankster has mixed some of his chemicals together in such a way that every two test tubes' contents were mixed into one tube with only 2 different chemicals in each tube as result of the prank. Gingy is a bit distressed, but he thinks he may still be able to carry out the experiment. If Gingy's experiment is to test which chemical reacts in a certain way to a special compound how should Gingy design his experiment using Randomization if only half of his chemicals were mixed by the prankster. |
|
Ungraded Open Response: |
|
Hints: |
|
|
| 178) Problem #PRAD87U "PRAD87U - 118127 - If Fred's New Gen..." |
|
If Fred's New Gen Tech Industry wants to test out the effectiveness of a new wireless headset that controls the mouse of one's computer in response to eye movement and he desires an unbiased data set. From research done by the scientists at his industry, Fred now knows that the results for the effectiveness of his new wireless headset will differ drastically among difference in a particular characteristic. Fred understands from this research that the effectiveness of his new wireless headset is impractical for people who are blind or very nearly blind. Although the effects are not necessarily so straightforward with people who are near sighted, far sighted, have 20-20 vision, have strained/weak retina (loss of eye focus), and bad eye-sight. With this information, which of the following data sets is the most appropriate for his experiment if he wishes to have as unbiased a data set as he can testing his current headset that he may adjust for the different sub groups based on the results of this experiment? |
Multiple Choice:
|
|
Hints: |
|
|
|
|
| 179) Problem #PRAEDNU "PRAEDNU - 122405 - Hysterian Systems..." |
|
Hysterian Systems is trying to test the effects of a new remote that is specifically for police to catch speeding cars remotely. Hysterian System's team of researchers have found that the effect of the remote to bring a targeted car's speed to match the position of the police car using a simple algorithm differs drastically between a car driving slightly over the speed limit and a car driving much higher than the speed limit. Which of the following data sets is the most suited for their experiment? |
Multiple Choice:
|
|
Hints: |
|
|
|
|
|
|
| 180) Problem #PRAD87Y "PRAD87Y - 118131 - What is wrong wit..." |
|
A)
What is wrong with this "completely randomized design"? AAAA BBBB CCCC DDDD |
Multiple Choice:
|
|
B)
What are factors of a completely randomized design? |
Check All That Apply:
|
|
Hints: |
|
|
|
C)
What type of degisn does this show? Treatment Gender Placebo Vaccine Male 250 250 Female 250 250 |
Multiple Choice:
|
Scaffold:
|
Scaffold:
|
Scaffold:
|
|
D)
It is known that men and women are physiologically different and react differently to medication. This design ensures that each treatment condition has an equal proportion of men and women. As a result, differences between treatment conditions cannot be attributed to gender. Which design would be best to have to represent this type of situation? |
Multiple Choice:
|
|
E)
All of the following are advantages of Completely Randomized Design except.... |
Multiple Choice:
|
|
F)
A completely randomized design is most appropriate when
I. Experimental units are similar. II. Several units may be destroyed or fail to respond. |
Algebraic Expression:
|
|
G)
Asses the validity of this statement: In Completely Randomized Design, the experiments work best when they are small such as laboratory experiments. |
Multiple Choice:
|
| 181) Problem #PRAD8XX "PRAD8XX - 117882 - Which of the foll..." |
|
Which of the following statements are true? I. A completely randomized design offers no control for lurking variables. II. A randomized block design controls for the placebo effect. III. In a matched pairs design, participants within each pair receive the same treatment. |
Multiple Choice:
|
|
Hints: |
|
|
| 182) Problem #PRAD8T4 "PRAD8T4 - 117763 - What is the first..." |
|
What is the first step in the completely randomization procedure? |
Multiple Choice:
|
| 183) Problem #PRAEAE3 "PRAEAE3 - 119312 - (Table I) T..." |
|
(Table I) Treatment Placebo Vaccine 500 500 (Table II) Treatment Placebo Vaccine Male 250 250 Female 250 250 Question Table _____ is categorized as randomized block design, while Table ____ is categorized as completely randomized block design. Write answer down as first answer, second answer. |
Exact Match (case sensitive):
|
|
Hints: |
|
|
|
|
| 184) Problem #PRAD974 "PRAD974 - 119096 - What is a charact..." |
|
What is a characteristic of completely randomized design? |
Check All That Apply:
|
| 185) Problem #PRAEDKC "PRAEDKC - 122328 - All completely ra..." |
|
A)
All completely randomized designs with one primary factor are defined by three numbers; what are they? |
Exact Match (case sensitive):
|
|
B)
What is the one disadvantage of CRD? |
Multiple Choice:
|
| 186) Problem #PRAEC5J "PRAEC5J - Open Response" |
|
As more and more consumers are taking sleep aids, the effectiveness of Eszopiclone (Lunesta) is being tested. Three hundred Men and women above the age of 30 years old with 6 hours of sleep or less agreed to take part in the experiment. One hundred of the participants will be placed either in a group that is given Eszopiclone, a placebo (essentially a sugar pill), or placed in a room with soothing music. Describe a completely randomized design that will show the effectiveness of each method. |
|
Ungraded Open Response: |
| 187) Problem #PRAECYX "PRAECYX - 121757 - Topic 19- Sampling Intro -- S. Sirage" |
|
When dealing with generalizations, one must realize the importance of sampling. Because there are many types of sampling and the probability of it not being able to represent all the given data correctly can vary, it's important to realize that both logic and better judgment is needed during it. Click the following link to read and get an introduction to sampling: http://www.statcan.gc.ca/edu/power-pouvoir/ch6/sampling-echantillonage/5214807-eng.htm |
Multiple Choice:
|
| 188) Problem #PRAEDUD "PRAEDUD - 122577 - Sampling Intro Part 2-- S. Sirage" |
|
Write a couple sentences explaining what you were able to gather from this exercise. |
|
Ungraded Open Response: |
| 189) Problem #PRAEDPV "PRAEDPV - 122437 - Topic 19- Voting- S. Sirage" |
|
Here is an interactive site with which you can further delve into sampling; it explores the pros and cons that come with voting. http://www.learner.org/interactives/statistics/ Note: Answer as if you were 18 and old enough to vote.  |
|
Ungraded Open Response: |
| 190) Problem #PRAEDUE "PRAEDUE - 122578 - Voting Pt. 2- S. Sirage" |
|
Did you complete the exercise? What were you able to learn about the voting process? |
|
Ungraded Open Response: |
| 191) Problem #PRAEAWC "PRAEAWC - Topic 19-- S. Sirage (Sampling)" |
|
Use this app for the following question: http://www.stat.tamu.edu/~west/applets/mandmtest.html You and your friend are looking to buy bags of M&M's for a party. The party requires that the colors that need to be served at this party are Red, Green and Yellow. The suggested number is about 200 total. Click the app above and try a couple samples. Based on looking at them, what can you conclude from the different colors represented? Are the same ratio of colors found in all of the bags? How many bags would you probably need to buy? |
|
Ungraded Open Response: |
| 192) Problem #PRAEDRW "PRAEDRW - 122500 - Use the following..." |
|
A)
Use the following link: http://stattrek.com/AP-Statistics-2/Experiment.aspx?Tutorial=Stat Experimemts are used to show: |
Multiple Choice:
|
|
Hints: |
|
|
|
B)
Using the graph on the following link, what can you conclude about this experiment and how does this differ from an observational study and sampling? http://www.sciencebuddies.org/science-fair-projects/project_data_analysis.shtml |
|
Ungraded Open Response: |
|
Hints: |
|
|
| C) |
|
Algebraic Expression: |
| 193) Problem #PRAEDUF "PRAEDUF - 122579 - Suppose two resea..." |
|
Suppose two researchers wanted to determine if aspirin reduced the chance of a heart attack. Researcher 1 studied the medical records of 500 patients. For each patient, he recorded whether the person took aspirin every day and if the person had ever had a heart attack. Then he reported the percentage of heart attacks for the patients who took aspirin every day and for those who did not take aspirin every day. Researcher 2 also studied 500 people. He randomly assigned half of the patients to take aspirin every day and the other half to take a placebo everyday. After a certain length of time, he reported the percentage of heart attacks for the patients who took aspirin every day and for those who did not take aspirin every day. Suppose that both researchers found that there is a statistically significant difference in the heart attack rates for the aspirin users and the non-aspirin users and that aspirin users had a lower rate of heart attacks. Can both researchers conclude that aspirin caused the reduction? |
Multiple Choice:
|
|
Hints: |
|
http://stattrek.com/AP-Statistics-2/Experiment.aspx?Tutorial=Stat |
| 194) Problem #PRAEDUN "PRAEDUN - 122585 - Suppose that you ..." |
|
Suppose that you were hired as a statistical consultant to design a experiment to examine the impact of a new medicine vs. a current medicine on migraines. 50 patients volunteer to participate in the study. What design will you recommend? |
Multiple Choice:
|
| 195) Problem #PRAEDT9 "PRAEDT9 - 122573 - There are three b..." |
|
A)
There are three basic types of study design--- observational studies, sample surveys, and experiments. Observational Studies: where values of the variable or variables of interest are recorded as they naturally occur. There is no interference by the researchers who conduct the study. Sample Surveys: a particular type of observational study where individuals report variables' values themselves, frequently by giving their opinions. Experiments: instead of assessing values of variables as they naturally occur, the researchers interfere, and they are the ones who assign values of the explanatory variable to the individuals. The reason why the researchers "take control" of the values of the explanatory variable is because they want to see how changes in the values of the explanatory variable affect the response. (Note: By nature, any experiment, then, involves at least two variables) |
Multiple Choice:
|
|
Hints: |
|
|
|
Hints: |
|
|
|
B)
What is the difference between observational studies and experiments? |
Multiple Choice:
|
|
Hints: |
|
|
|
C)
Suppose researchers want to determine whether people tend to snack more while they watch TV. In other words, the researchers would like to explore the relationship between the expalnatory variable "TV" (a categorical variable that takes the values 'on' and 'not on') and the response "snack consumption". Identify each of the following designs as being an observational study, a sample survey, or an experiment. 1. Recruit participants for the study. While they are presumably waiting to be interviewed, half of the individuals sit in a waiting room with snacks available and a TV on. The other half sit in a waiting room with snacks available and no TV, just magazines. Researchers determine whether people consume more snacks in the TV setting. What type of data collection is this? |
Multiple Choice:
|
|
Hints: |
|
|
|
D)
2. Recruit participants for a study. Give them journals to record hour by hour their activities the following day, including TV watched and food consumed. Determine if food consumption is higher during TV times. What type of data collection is this? |
Multiple Choice:
|
|
Hints: |
|
|
|
E)
3. Recruit participants for a study. Ask them to recall, for each hour of the previous day, whether they were watching TV, and what food they consumed each hour. Determine whether food consumption was higher during the TV times. What type of data collection is this? |
Multiple Choice:
|
|
Hints: |
|
|
|
F)
4. Poll a sample of individuals with the following question: While watching TV, do you tend to snack (a) less than usual (b) more than or usual (c) the same amount as usual? What type of data collection is this? |
Multiple Choice:
|
|
Hints: |
|
|
| 196) Problem #PRAEC5E "PRAEC5E - 121896 - Inferences to pop..." |
|
Inferences to population can be made from surveys and observational studies only if subjects of the surveys and observational studies are selected at random. Cause - effect relationships between explanatory and response variables are the results that can be drawn from experiments only when treatments are randomly assigned to groups. Read and understand this concept. It is a short but confusing concept that one can make many mistakes on. When you are ready to move on type "1" into the answer box below. |
Algebraic Expression:
|
| 197) Problem #PRAD8TS "PRAD8TS - 117753 - Can one generaliz..." |
|
Can one generalize results of a survey if the subjects were randomly chosen? |
Multiple Choice:
|
| 198) Problem #PRAEBXE "PRAEBXE - 120749 - Can one generaliz..." |
|
Can one generalize results of an observational study when subjects are randomly chosen? |
Multiple Choice:
|
|
Hints: |
|
|
| 199) Problem #PRAEBXJ "PRAEBXJ - 120753 - What type of conc..." |
|
What type of conclusions can be drawn from a survey where subjects are chosen randomly? |
Multiple Choice:
|
| 200) Problem #PRAEBXM "PRAEBXM - 120755 - What type of conc..." |
|
What type of conclusions can be drawn from observational studies where subjects are chosen randomly? |
Multiple Choice:
|
| 201) Problem #PRAEBXN "PRAEBXN - 120756 - What type of conc..." |
|
What type of conclusion can be drawn from an experiment where treatments are assigned to random groups? |
Multiple Choice:
|
| 202) Problem #PRAEC44 "PRAEC44 - 121886 - Can results of su..." |
|
Can results of surveys be generalized if the subjects were not chosen at random? |
Multiple Choice:
|
|
Hints: |
|
|
| 203) Problem #PRAEC48 "PRAEC48 - 121890 - Can observational..." |
|
Can observational studies be generalized if subjects were not chosen randomly? |
Multiple Choice:
|
| 204) Problem #PRAEDPX "PRAEDPX - 122439 - Can cause - effec..." |
|
Can cause - effect relationships between explanitory and response variables be generalized if the treatments were not assigned to groups at random? |
Multiple Choice:
|
| 205) Problem #PRAEDPY "PRAEDPY - 122440 - If you wanted to ..." |
|
If you wanted to make an inference to the population, which of the following would you conduct? |
Multiple Choice:
|
Scaffold:
|
Scaffold:
|
| 206) Problem #PRAEDP6 "PRAEDP6 - 122446 - Which of the foll..." |
|
Which of the following would you NOT conduct to get an inference to the population? |
Multiple Choice:
|
| 207) Problem #PRAEDQH "PRAEDQH - 122457 - If Johnny wanted ..." |
|
If Johnny wanted to take a poll on which team was better- the Boston Red Sox or the New York Yankees- how should Johnny conduct the poll in order to generalize the results as an inference to the population? |
Multiple Choice:
|
| 208) Problem #PRAEDQK "PRAEDQK - 122459 - Bob wants to see ..." |
|
Bob wants to see if drinking water makes you eat less. How should Bob conduct his experiment in order for him to be able to generalize the results? |
Multiple Choice:
|
| 209) Problem #PRAEDQZ "PRAEDQZ - 122472 - Which survey can ..." |
|
Which survey can be used to get an inference to the entire population? |
Multiple Choice:
|
| 210) Problem #PRAEDRG "PRAEDRG - 122487 - Which sample shou..." |
|
Which sample should a company use if they wanted to determine the popularity of their product? |
Multiple Choice:
|
| 211) Problem #PRAEDQV "PRAEDQV - 122468 - If Dexter wants t..." |
|
If Dexter wants to test out his hypothesis of whether all plants are happier listening to classical music, can he make a generalization of the entire plant population if he tested on only the sunflower? |
Multiple Choice:
|
| 212) Problem #PRAEARQ "PRAEARQ - 119611 - When a dotplot is..." |
|
When a dotplot is skewed right the median is on the left. |
Multiple Choice:
|
| 213) Problem #PRAEARR "PRAEARR - 119612 - The difference be..." |
|
The difference between a stem and leaf plot and a dot plot is |
Multiple Choice:
|
| 214) Problem #PRAD8VA "PRAD8VA - 117800 - A stem and leaf d..." |
|
A stem and leaf display is a good method of displaying large amounts of data. |
Multiple Choice:
|
| 215) Problem #PRAD8XJ "PRAD8XJ - 117870 - If the Minnesota ..." |
|
If the Minnesota Vikings have a team of over 53 men with the smallest man 5'9" and the tallest at 6'8" Would it be better to display this information on a stemplot or a dotplot? |
Multiple Choice:
|
| 216) Problem #PRAECJJ "PRAECJJ - 121342 - Which gives more ..." |
|
Which gives more detailed information a stem and leaf plot or a dot plot |
Multiple Choice:
|
| 217) Problem #PRAD9FS "PRAD9FS - 118373 - Greg Jennings is..." |
 Greg Jennings is one fast dude. He is notorious for his explosive speed and his ablility to put his team on his back. Below is a stemplot showing the number of touchdowns Greg Jennings has scored during each season of his career. what is the average touchdowns he has scored in a season? 0 / 2 0 / 1 / 24 1 / 789 2 / 12 2 / |
Multiple Choice:
|
| 218) Problem #PRAD9E5 "PRAD9E5 - 118353 - This Dotplot has ..." |
This Dotplot has a normal distribution |
Multiple Choice:
|
| 219) Problem #PRAD9D5 "PRAD9D5 - 118322 - What is the distr..." |
|
What is the distribution of this stem and leaf plot? Stems / Leaves 1 / 2457699999999999999999999999999999999999999 2 /45666666888888888888999999999 3 /555555555555 4 /2344 5 /45 6 /23 |
Multiple Choice:
|
| 220) Problem #PRAEBMU "PRAEBMU - 120452 - A stem and leaf p..." |
|
A stem and leaf plot is |
Multiple Choice:
|
| 221) Problem #PRAECHR "PRAECHR - 121317 - In the following ..." |
|
In the following stem and leaf plot is # a stem or a leaf 1 / # 2 / 5 |
Multiple Choice:
|
| 222) Problem #PRAEARE "PRAEARE - 119602 - Stemplot is to Ve..." |
|
Stemplot is to Vertical as Dotplot is to_____ |
Multiple Choice:
|
| 223) Problem #PRAECYA "PRAECYA - 121737 - Is this a dotplot..." |
Is this a dotplot or a stem and leaf plot |
Multiple Choice:
|
| 224) Problem #PRAECJK "PRAECJK - 121343 - Stem and Leaf plo..." |
|
Stem and Leaf plot is related to dot plot how? |
Multiple Choice:
|
| 225) Problem #PRAEBZD "PRAEBZD - 120810 - 1 / 1234 2 / 234 ..." |
|
1 / 1234 2 / 234 3 / 0 The stem and leaf plot above shows which set of numbers? |
Multiple Choice:
|
| 226) Problem #PRAECX5 "PRAECX5 - 121732 - The stemplot belo..." |
|
The stemplot below represents the points allowed by the Green Bay Packers in their last 16 games. What is the median of the stemplot? 1 / 00447 2 / 111448 3 / 116 4 / 18 |
Multiple Choice:
|
| 227) Problem #PRAECXZ "PRAECXZ - 121728 - Forest Gump once ..." |
|
Forest Gump once said "You know it's funny what a young man recollects?" What do you recollect from these questions? |
|
Ungraded Open Response: |
| 228) Problem #PRAEDRE "PRAEDRE - 122485 - How would you pop..." |
|
How would you poperly represent this data plot. Ten strangers were asked how many hours a week they spent doing exercize in a week, here are the results: 5,6,5,8,10,9,9,7,5 A) B) C) * * * * * * * * * * * * * * * * * * * * * * * * 4-6 7-9 10-13 5 6 7 8 9 10 5 6 5 8 10 9 9 7 5 |
Multiple Choice:
|
|
Hints: |
|
http://www.vertex42.com/ExcelArticles/dot-plot.html |
| 229) Problem #PRAECZ9 "PRAECZ9 - 121798 - This data represe..." |
|
This data represents the average age of randomly selected NHL players in the year 2009. We want to make a dot plot out of the data set. But first we need to know it contains any outliers. Does it? 24,37,29,19,19,23,28,33,29,20,22,31,22,25,28,32,33,35,45,18,47, 28,30 |
Multiple Choice:
|
|
Hints: |
|
3,5,7,4,2,7,3,19,3,2,20,4,6,7,21. |
| 230) Problem #PRAECZK "PRAECZK - 121777 - Which is correct ..." |
|
Which is correct about a dotplot? |
Multiple Choice:
|
|
Hints: |
|
|
| 231) Problem #PRAEAB5 "PRAEAB5 - 119221 - A) &nb..." |
|
A) B) * * C) * * * * * * * * * * * * * * * * * * * * * * * * * * * 0 1 2 3 4 0 1 2 3 4 0 1 2 3 4 Here is data plot represenents the number of fouls represented by randomly selected NBA players. Which data plot reveals a uniform distribution set? |
Multiple Choice:
|
|
Hints: |
|
|
| 232) Problem #PRAEABF "PRAEABF - Dotplot" |
|
* * * * * * * * * * * * * * * * * * * * * 0 1 2 3 4 5 6 7 8 This data set represents the number of shots attempted by randomly selected NHL players in a single game. Does this data set contain any outliers? |
Multiple Choice:
|
Scaffold:
|
| 233) Problem #PRAD9ZY "PRAD9ZY - Data plot distribution" |
|
* * * * * * * * * * * * * * * * * * * * * 0 1 2 3 4 5 6 7 8 This data set represents the number of shots attempted by randomly selected NHL players in a single game. Describe the distribution |
Multiple Choice:
|
Scaffold:
|
| 234) Problem #PRAEDQ3 "PRAEDQ3 - 122474 - Multiply the ste..." |
 Multiply the stem by 10, after that whats the biggest number in this set of data |
Exact Match (case sensitive):
|
|
Hints: |
|
|
|
|
| 235) Problem #PRAEDQE "PRAEDQE - 122454 - Why are there mu..." |
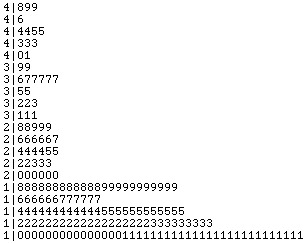 Why are there multiple stems starting with the same number? |
Multiple Choice:
|
| 236) Problem #PRAECZ6 "PRAECZ6 - 121795 - 4|33 3..." |
|
4|33 3|56 2|00456 1|00134 0|1245589 -0|0679 -1|005559 -2|7 How many negative numbers are in this stem plot? |
Multiple Choice:
|
|
Hints: |
|
|
|
|
| 237) Problem #PRAD8YE "PRAD8YE - 117897 - What is t..." |
 What is the mean of this stem and leaf plot? |
Multiple Choice:
|
|
Hints: |
|
|
|
|
|
|
| 238) Problem #PRAEABX "PRAEABX - 119215 - Figure 3. Back..." |
|
Multiple Choice:
|
|
Hints: |
|
|
|
|
| 239) Problem #PRAD93K "PRAD93K - 118956 - 3|23372|00111..." |
What number is the mode in this stem plot? |
Exact Match (case sensitive):
|
Scaffold:
|
| 240) Problem #PRAEDN5 "PRAEDN5 - 122414 - Weights of NFL ha..." |
|
Weights of NFL half backs __________________________________ 185 195 205 215 225 235 245 The Arizona Cardinals have not signed a running back under 185 pounds. What is the chance of a 185.5 pounder making the team considering weight standards? |
Multiple Choice:
|
|
Hints: |
|
|
|
|
|
|
|
|
| 241) Problem #PRAEDNJ "PRAEDNJ - 122396 - Common Adult Shoe..." |
|
Common Adult Shoe Sizes ______________________________ 6 7 8 9 10 11 12 If an online sneaker carrier only has sizes 7-11 left in stock, what percentage of people cannot purchase off the website? |
Algebraic Expression:
|
|
Hints: |
|
|
|
|
| 242) Problem #PRAEDM8 "PRAEDM8 - 122386 - x &nbs..." |
|
x x x x x x x x x x x x x x x x x x x x x x x x x x x x x _______________________________________________ 6 7 8 9 10 11 12 13 14 Bags of candy How would the distubution above be desrcibed? |
Multiple Choice:
|
| 243) Problem #PRAECZG "PRAECZG - 121774 - Hours Of Sleep (x..." |
|
Hours Of Sleep (x-hours, y-people) * * * * * * * * *___*_______*__*___*__*___*____*__ *___ 3 4 5 6 7 8 9 10 11 12 What is the average number of hours of sleep in this data set? |
Multiple Choice:
|
| 244) Problem #PRAEABK "PRAEABK - 119204 - 57,60,70,84,58,60..." |
|
A)
57,60,70,84,58,60,66,72,63,63,75,61,68,71,70,80,59,69,66,78,74,70,69,72,67,73,76 Given the set of numbers above, which of the following statements is accurate? |
Multiple Choice:
|
|
Hints: |
|
|
|
|
|
|
|
|
| B) |
|
Algebraic Expression: |
| 245) Problem #PRAEDMD "PRAEDMD - 122360 - Which is true abo..." |
|
Which is true about normal distributions? |
Multiple Choice:
|
| 246) Problem #PRAECZD "PRAECZD - 121771 - In the equation&n..." |
|
A)
In the equation |
Multiple Choice:
|
|
B)
What is |
Multiple Choice:
|
| 247) Problem #PRAEDJE "PRAEDJE - 122299 - For one week at B..." |
|
A)
For one week at Boston Latin School, the number of students that bought a school lunch was recorded. If the bottom 1.5% is at 196 and the top 1.5% is at 234, what is the mean of the data? |
Exact Match (case sensitive):
|
|
Hints: |
|
|
|
B)
Using your previous answer and the z chart, what is the standard deviation? Round to the nearest one-hundredth. |
Exact Match (case sensitive):
|
|
Hints: |
|
|
Scaffold:
|
| 248) Problem #PRAECZJ "PRAECZJ - 121776 - A normal distribu..." |
|
A normal distribution has a mean of 22 and a standard deviation of 2. What percentage of the data lies below 20? |
Multiple Choice:
|
|
Hints: |
|
|
|
|
|
|
| 249) Problem #PRAD8VV "PRAD8VV - 117818 - Mr. Simoneau's AP..." |
|
Mr. Simoneau's AP Stats class just took a chapter three quiz. If 2.5% of people scored to the left of 76 and 2.5% scored to the right of 80, what is the mean score? |
Multiple Choice:
|
| 250) Problem #PRAEAW5 "PRAEAW5 - 119779 - Suppose that foot..." |
Suppose that foot length of a randomly chosen adult male is a normal random variable with mean μ=11 and standard deviation σ=1.5. Then the Standard Deviation Rule lets us sketch the probability distribution of X as follows: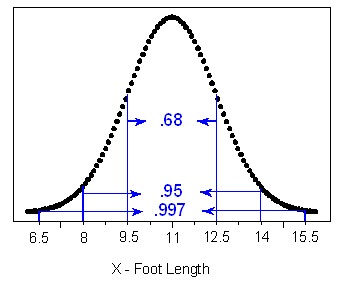 This graph shows the length of adult male feet. The probability is only 2.5% that an adult male will have a foot longer than how many inches? Barbara Illowsky and Susan Dean, "Collaborative Statistics," Connexions, March 22, 2010, http://cnx.org/content/col10522/1.38/ |
Multiple Choice:
|
| 251) Problem #PRAEDJA "PRAEDJA - 122295 - For one week, Nei..." |
|
For one week, Neiman Marcus decided to record the sizes of every pair of shoes bought by customers. At the end of the week, the data was compiled and it was determined the mean shoe size purchased was an 8, with a standard deviation of .5 sizes. What shoe size represents the bottom 2.5% of shoes sold? What size represents the top 2.5% sold? |
Multiple Choice:
|
|
Hints: |
|
|
| 252) Problem #PRAEDJM "PRAEDJM - 122305 - The number of hot..." |
|
A)
The number of hot chocolates ordered at Starbucks daily was recorded for one week. The data had a mean of 42. If the number 48 corresponded to the z-score of 2.47, determine the standard deviation of the data. |
Multiple Choice:
|
|
B)
Using the data from the previous problem, determine the z-score of 37 |
Multiple Choice:
|
| 253) Problem #PRAEARK "PRAEARK - 119607 - What is the area ..." |
|
What is the area underneath a normal distribution bell-curve? |
Algebraic Expression:
|
| 254) Problem #PRAD8VP "PRAD8VP - 117812 - Students re..." |
|
Students recently took the SATs. Out of a composite score of 2400, the mean score was 1800, with a standard deviation of 100 points. What percent of students scored above 2050 on their SATs? |
Algebraic Expression:
|
|
Hints: |
|
|
| 255) Problem #PRAD9NP "PRAD9NP - 118556 - Mangia Pizza adve..." |
|
Mangia Pizza advertises in the newspaper that all of its thick crust pizzas have a crust of 1.5 inches. In reality, the mean of their crusts' thickness is 1.3 inches with a standard deviation of .1 inches. How thick is crust of the the bottom 1.1%? |
Multiple Choice:
|
| 256) Problem #PRAEAU7 "PRAEAU7 - 119719 - A group of ..." |
|
A group of students at a school takes a history test. The distribution is normal with a mean of 25, and a standard deviation of 4. (a) Everyone who scores in the top 30% of the distribution gets a certificate. What is the lowest score someone can get and still earn a certificate? David Lane, "Online Statistics:An Interactive Multimedia Course of Study," Online Statbook, October 27,2010, http://onlinestatbook.com/ |
Multiple Choice:
|
|
Hints: |
|
|
| 257) Problem #PRAEDJW "PRAEDJW - 122314 - J.Crew decided to..." |
|
J.Crew decided to count the number of shoppers that entered the store daily for one month. When they compiled data, it was determined that the mean number of shoppers daily was 202. If 1.5% of the data lay below 172 and 1.5% lay above 232, what was the standard deviation of the data? Round to the nearest one-hundredth. |
Exact Match (case sensitive):
|
Scaffold:
|
Scaffold:
|
Scaffold:
|
Scaffold:
|
| 258) Problem #PRAEBTH "PRAEBTH - 120628 - Shoppers at Urban..." |
|
Shoppers at Urban Outfitters were asked how much they paid for a pair of jeans. When the data was recored, the mean price paid was $54, with a standard deviation of $4. What percentage of shoppers bought their jeans between the prices of $47 and $60? |
Multiple Choice:
|
|
Hints: |
|
|
| 259) Problem #PRAD9MU "PRAD9MU - 118530 - The Real D..." |
|
The Real Deal sub shop recently asked its patrons how much they spend weekly at the shop. From the data they collected, the mean was $24 with a standard deviation of $2. What's the probability that someone spends more than $28.5 a week at the Real Deal? |
Multiple Choice:
|
| 260) Problem #PRAD8X2 "PRAD8X2 - 117885 - The weights of si..." |
|
The weights of sixie backpacks follow a normal distribution with a mean weight of 40 lbs. and a standard deviation of 3 lbs. What percentage of sixies have backpacks larger than 45 lbs.? |
Algebraic Expression:
|
Scaffold:
|
Scaffold:
|
Scaffold:
|
| 261) Problem #PRAEACM "PRAEACM - 119236 - What is the proba..." |
|
What is the probability that, on a normal distribution with a mean of 40 and standard deviation of 3, x=39? |
Algebraic Expression:
|
|
Hints: |
|
|
| 262) Problem #PRAEC28 "PRAEC28 - 121828 - Find the probabil..." |
|
Find the probability: P(-0.7<Z<1.5)= |
Algebraic Expression:
|
|
Hints: |
|
|
| 263) Problem #PRAEBVK "PRAEBVK - 120692 - &nbs..." |
  A B Which normal probability plot represents the data from the normal distribution? (A or B) Plot A taken from: meloun.upce.cz Plot B taken from: bjo.bmj.com |
Algebraic Expression:
|
| 264) Problem #PRAEBT7 "PRAEBT7 - 120649 - A ruler comp..." |
|
A ruler company advertises that it supplies 12 inch rulers to Staples. In fact, the length of the rulers have a mean value of 12.15 inches with a standard deviation of 0.03. What percentage of rulers are between 12.05 and 12.19? |
Multiple Choice:
|
Scaffold:
|
Scaffold:
|
Scaffold:
|
| 265) Problem #PRAEC3E "PRAEC3E - 121834 - The weight of bal..." |
|
The weight of ballerinas is normally distributed with a mean 96 lbs. and a standard deviation of 2 lbs. What is the area of weight of ballerinas that lies to the left of 97.5 lbs? |
Algebraic Expression:
|
| 266) Problem #PRAEACQ "PRAEACQ - 119239 - In a certain norm..." |
|
In a certain normal distribution, 15.85% of the area lies to the left of 47 and 15.85% lies to the right of 53. What is the mean and standard deviation? |
Multiple Choice:
|
Scaffold:
|
Scaffold:
|
Scaffold:
|
Scaffold:
|
| 267) Problem #PRAD96R "PRAD96R - 119054 - If I am 3 standar..." |
|
If I am 3 standard deviations below the mean, what is my z-score? |
Algebraic Expression:
|
Scaffold:
|
Scaffold:
|
| 268) Problem #PRAD87A "PRAD87A - 118110 - New England has a..." |
|
New England has an average temperature of 55 degrees in October with a standard deviation of 2 degrees. What temperature lies in the 87th percentile? |
Multiple Choice:
|
Scaffold:
|
Scaffold:
|
Scaffold:
|
| 269) Problem #PRAD8VY "PRAD8VY - 117821 - What is the term ..." |
|
What is the term for taking original data values and converting them to standard deviation units? |
Multiple Choice:
|
|
Hints: |
|
|
| 270) Problem #PRAD934 "PRAD934 - 118972 - What is the name ..." |
|
What is the name of a standardized value? |
Multiple Choice:
|
|
Hints: |
|
|
| 271) Problem #PRAD94Y "PRAD94Y - 118999 - What is the area ..." |
|
What is the area under any given denisty curve? |
Multiple Choice:
|
|
Hints: |
|
|
| 272) Problem #PRAEABJ "PRAEABJ - 119203 - The mean of a den..." |
The mean of a density curve is the "balancing point", which means that if the curver were made oif solid material it would balance at that point. The median is the "equal areas point, that divides the area under the curve in half. In a normal distribution how does the mean relate to the median? In a normal distribution how does the mean relate to the median? |
Multiple Choice:
|
|
Hints: |
|
|
|
|
| 273) Problem #PRAEABY "PRAEABY - 119216 - Where is 68% of t..." |
|
Where is 68% of the data located? |
Multiple Choice:
|
|
Hints: |
|
|
| 274) Problem #PRAD8V3 "PRAD8V3 - 117824 - Normal distributi..." |
|
Normal distributions do not necessarily have the same means and standard deviations. A normal distribution with a mean of 0 and a standard deviation of 1 is called a standard normal distribution. Areas of the normal distribution are often represented by tables of the standard normal distribution. A portion of a table of the standard normal distribution is shown in Table 1.
The first column titled "Z" contains values of the standard normal distribution; the second column contains the area below Z. Since the distribution has a mean of 0 and a standard deviation of 1, the Z column is equal to the number of standard deviations below (or above) the mean. For example, a Z of -2.5 represents a value 2.5 standard deviations below the mean. The area below Z is 0.0062. Online Statistics: An Interactive Multimedia Course of Study, http://onlinestatbook.com/ Do you understand what the value of Z stands for? |
Multiple Choice:
|
| 275) Problem #PRAEAB2 "PRAEAB2 - 119218 - A value from any ..." |
|
A value from any normal distribution can be transformed into its corresponding value on a standard normal distribution using the following formula: Z = (X - μ)/σ where Z is the value on the standard normal distribution, X is the value on the original distribution, μ is the mean of the original distribution and σ is the standard deviation of the original distribution. As a simple application, what portion of a normal distribution with a mean of 50 and a standard deviation of 10 is below 26. Applying the formula we obtain Z = (26 - 50)/10 = -2.4. From Table 1, we can see that 0.0082 of the distribution is below -2.4. This value represents the area of the portion that is below. It also means that 0.82% of the data lies below the value of 26 since the total area of a normal distribution is always equal to 1. To find the portion of a normal distribution above a value, simply use the equation to find the disribution below that value and subtract it from 1, the value of the whole distribution. What portion of a normal distribution with a mean of 50 and a standard deviation of 10 is above 26? Applying the formula we obtain Z = (26 - 50)/10 = -2.4. From Table 1, we can see that 0.0082 of the distribution is below -2.4 but since this value is for the portion below 26 and we're trying to find the portion above we would have to subtract this value from one. 1 - 0.0082 = 0.9918 This means that 99.18% of the data lies above the value of 26. Do you understand how to find the area of a normal distribution? |
Multiple Choice:
|
| 276) Problem #PRAEACC "PRAEACC - 119228 - A standard normal..." |
|
A standard normal distribution has: |
Multiple Choice:
|
| 277) Problem #PRAEACG "PRAEACG - 119232 - A number 2.5 stan..." |
|
A number 2.5 standard deviations above the mean has a Z score of: |
Multiple Choice:
|
| 278) Problem #PRAECZ4 "PRAECZ4 - 121793 - A normal distribu..." |
|
A normal distribution has a mean of 110 and a standard deviation of 20. What percent of the data lie between 85 and 130? |
Multiple Choice:
|
|
Hints: |
|
|
|
|
|
|
| 279) Problem #PRAEC2A "PRAEC2A - 121799 - A normal distribu..." |
|
A normal distribution has a mean of 50 and a standard deviation of 3. What portion of the data is over 53? |
Multiple Choice:
|
|
Hints: |
|
|
|
|
|
|
| 280) Problem #PRAEDNS "PRAEDNS - 122403 - In a normal distr..." |
|
In a normal distribution with a standard deviation of 2.5, 60% of the data lies to the left of 58. What is the mean? |
Multiple Choice:
|
|
Hints: |
|
|
|
|
|
|
|
|
|
|
| 281) Problem #PRAEDNZ "PRAEDNZ - 122410 - In a normal distr..." |
|
In a normal distribution with a mean of 62, 30% of the data lies below 54. What is the standard deviation? |
Multiple Choice:
|
|
Hints: |
|
|
|
|
|
|
|
|
|
|
| 282) Problem #PRAEDQQ "PRAEDQQ - 122463 - A normal distribu..." |
|
A normal distribution with a mean of 75 has 45% of its data above 82. What is the standard deviation? |
Multiple Choice:
|
|
Hints: |
|
|
| 283) Problem #PRAEDQU "PRAEDQU - 122467 - Now let's try a w..." |
|
Now let's try a word problem: A pizza shop makes pizzas with an average of 13 inches in diameter. Occasionally, the workers would make pizzas that are smaller than that size, represented by a standard deviation of 0.2 inches. Pizzas that are made under 12.75 inches must be tossed out. What percent of the pizzas made must be thrown out? |
Multiple Choice:
|
| 284) Problem #PRAEACE "PRAEACE - 119230 - On a recent..." |
|
A)
On a recent midterm, 200 students scored a mean of 72 with a standard deviation of 6. Marisa scored higher than 68% of her peers. Her teacher said he would give her 5 points of extra credit on the exam if she could tell him her score using only her percentile and the median and standard deviation. What is her score? Always round to the nearest hundreth if necessary |
Algebraic Expression:
|
Scaffold:
|
Scaffold:
|
|
B)
Marisa was able to find her score on the test, so her teacher gave her the 5 points of extra credit. If Marisa was the only student able to find her score in this manner, and the standard deviation is unaffected while the mean shifts to 72.05, what would her new percentage be if the test was out of 60 points? Always round to the nearest hundreth if necessary |
Algebraic Expression:
|
Scaffold:
|
Scaffold:
|
Scaffold:
|
| 285) Problem #PRAD9Z2 "PRAD9Z2 - 118908 - The baseball..." |
|
The baseball team x has a mean batting average of .261 and a standtard deviation of .05. If player y has a batting average of .298, which percentile is he in? |
Algebraic Expression:
|
Scaffold:
|
Scaffold:
|
| 286) Problem #PRAEDJP "PRAEDJP - 122307 - Shaniqua buys a c..." |
|
A)
Shaniqua buys a cow to feed her 12 children at the country fair for $978 and then goes to get it appraised by a farmer/statistician. He tells her that the mean price for cows is $500 and the standard deviation is $173. How many deviations did Shaniqua pay above the mean? Round to the nearest one-hundredth. |
Multiple Choice:
|
|
B)
Shaniqua's husband Alan comes home and is enraged that she paid so much for a cow to feed children that aren't his, and has her go back to return the cow. After Shaniqua returns the cow, another farmer offers to sell his cow at a price 1.75 deviations under the mean. How much is the farmer selling his cow for? |
Multiple Choice:
|
| 287) Problem #PRAEDJH "PRAEDJH - 122302 - Alan makes buns f..." |
|
A)
Alan makes buns for a living, the mean weight of all his buns is .5lbs and the standard deviation is .08lbs. What percentage of his buns will weigh more than .36lbs? |
Multiple Choice:
|
|
B)
If 70% of Alan's buns have to weigh more than .60lbs, what must be the new standard deviation? Round to the nearest one-hundredth. |
Multiple Choice:
|
| 288) Problem #PRAEDFY "PRAEDFY - 122223 - Alan is working i..." |
|
A)
Alan is working in a factory that makes toothpaste for Colgate (extra whitening). He must throw away tubes that have toothpaste under 51 grams and tubes that exceed 54 grams. Luckily, the mean amount of toothpaste in the tubes is 52.5 grams and the standard deviation is .8 grams. Find the z-score for the amount of toothpaste under 53 grams. |
Multiple Choice:
|
|
B)
Referring to the previous question, what is the probability that the amount of toothpaste in Colgate tubes would be less than 54.7 grams? |
Multiple Choice:
|
|
C)
Referring to the toothpaste problem again, how many grams of toothpaste correspond to the 30th percentile? |
Multiple Choice:
|
|
D)
Referring back to the toothpaste problem, what is the probability that Alan will have to throw away a tube of toothpaste because it doesn't fall within guidelines? |
Multiple Choice:
|
| 289) Problem #PRAEDFV "PRAEDFV - 122220 - Alan owns a baker..." |
|
A)
Alan owns a bakery and makes 100 juicy buns everyday. He claims to use 10 ounces of sugar for each bun but in reality, the amount of sugar on a random bun is normally distributed with a mean value of 12 oz and a standard deviation of 0.5 oz. What is the z-score of a juicy bun that has 11 oz of sugar? |
Algebraic Expression:
|
|
B)
What percent of buns have less than 11 ounces of sugar? |
Multiple Choice:
|
|
C)
One afternoon, an old lady comes into the bakery to complain that her bun was too sweet. The next day, a young boy says that his bun is not sweet enough. Alan decides to throw away the 5 buns with the most sugar and the 5 buns with the least sugar everyday. The buns that are left will contain how much sugar? |
Multiple Choice:
|
Scaffold:
|
Scaffold:
|
Scaffold:
|
Scaffold:
|
Scaffold:
|
|
D)
What percent of the buns will have exactly 11 ounces of sugar? |
Multiple Choice:
|
| 290) Problem #PRAEACA "PRAEACA - 119226 - Referring to the..." |
 Referring to the image above, which curve has a larger standard deviation? |
Multiple Choice:
|
| 291) Problem #PRAEABU "PRAEABU - 119212 - What percentage o..." |
|
A)
What percentage of the area of the normal distribution curve falls within 1 standard deviation from the mean? |
Multiple Choice:
|
|
B)
When 95% of the area under the normal distribution curve is represented, within how many standard deviation(s) does it fall from the mean? |
Multiple Choice:
|
|
C)
According to the Empirical Rule, what is the area under the normal distribution curve when X is -1 standard deviations from the mean? |
Multiple Choice:
|
| 292) Problem #PRAD9Z4 "PRAD9Z4 - 118910 - Alan buys a bar o..." |
A)
Alan buys a bar of soap (Dove creamy & silky smooth) from the convenience store. He showers on random days and he records the weight of the soap each day that he uses it. Day Weight of soap (g)
0	124
1	121
4	103
5	96
6	90
7	84
8	78
9	71
11	58
12	50
17	27
19	16
20	12
21	8
22	6
Rex Boggs, "Bar of Soap", Glenmore State High School, accessed 26 Oct 2010, www.statsci.org/data/oz/soap.html
Find the mean of the weight (g) and round to the nearest hundredth.
|
Algebraic Expression:
|
|
B)
Find the standard deviation of the previous data and round to the nearest hundredth. |
Algebraic Expression:
|
|
C)
Alan comes home late one night from the clüb and is feeling really filthy. If Alan wants to have his bar of soap to weigh at least 118 grams when he showers, what is the probability of that happening? |
Multiple Choice:
|
| 293) Problem #PRAD9FA "PRAD9FA - 118358 - When creating a g..." |
|
When creating a graph in terms of normal distribution, the result is impacted by which two factors? |
Multiple Choice:
|
| 294) Problem #PRAD9FB "PRAD9FB - 118359 - What deter..." |
|
What determines the shape of a graph of normal distribution? |
Multiple Choice:
|
Scaffold:
|
| 295) Problem #PRAEARM "PRAEARM - 119608 - In an ordered pai..." |
|
In an ordered pair referring to the density curve of a normal distribution graph, (10,3) the 10 refers to __ and the 3 refers to __ |
Multiple Choice:
|
|
Hints: |
|
|
| 296) Problem #PRAD9D6 "PRAD9D6 - 118323 - The empirical rul..." |
|
The empirical rule states that about what percentage of the area of the density curve falls within 1 standard deviation of the mean? |
Algebraic Expression:
|
|
Hints: |
|
|
|
| 297) Problem #PRAEARP "PRAEARP - 119610 - What is the..." |
|
What is the probability when z= -1.5? |
Algebraic Expression:
|
|
Hints: |
|
|
| 298) Problem #PRAEBYH "PRAEBYH - 120783 - In a standard&nbs..." |
|
In a standard normal distribution, find the probability that: P(Z<-1.4) |
Multiple Choice:
|
|
Hints: |
|
|
| 299) Problem #PRAEBYQ "PRAEBYQ - 120789 - In a standard nor..." |
|
In a standard normal distribution, find the probability that: P(z=-1.4) |
Algebraic Expression:
|
Scaffold:
|
Scaffold:
|
| 300) Problem #PRAEBYK "PRAEBYK - 120785 - In a standard nor..." |
|
In a standard normal distribution, find the probability that: P(-1.4<Z<0.6) (to the nearest ten-thousandth) |
Algebraic Expression:
|
Scaffold:
|
Scaffold:
|
| 301) Problem #PRAEARV "PRAEARV - 119616 - In a normal distr..." |
|
In a normal distribution, 2.5% of the area lies to the left of 51 and 2.5% lies to the right of 57. Find the mean. |
Algebraic Expression:
|
| 302) Problem #PRAEARW "PRAEARW - 119617 - Refer to the prev..." |
|
Refer to the previous problem in which 2.5% was to the left of 51, and 2.5% to the right of 57, and we found that the mean=54 What is the standard deviation? |
Algebraic Expression:
|
Scaffold:
|
Scaffold:
|
| 303) Problem #PRAEBYT "PRAEBYT - 120792 - A supermarket adv..." |
|
A supermarket advertises that the weight of turkeys is 5 lbs. The weight of turkeys randomly weighed is normally distributed with a mean value of 4.5 lbs, and a standard deviation of 0.2 lbs. What is the probability that a randomly selected turkey weighs more 5 lbs? (to the nearest ten-thousandth) |
Algebraic Expression:
|
|
Hints: |
|
predicted=5, mean=4.5, standard deviation= 0.2 Equation: z=predicted-mean/standard deviation |
|
Look at the zscore to find the area |
|
|
|
|
| 304) Problem #PRAECYC "PRAECYC - 121739 - Refer back to the..." |
|
Refer back to the supermarket question where the mean of turkeys sold is 4.5 and the standard deviation is 0.2. Without calculating, would the probability of the normal distribution graph be higher or lower if the standard deviation was instead 0.3? |
Multiple Choice:
|
| 305) Problem #PRAECYF "PRAECYF - Supermarket 3" |
|
Refer back to supermarket problem again. What is the probability that a randomly selected turkey would weigh less than 4.3? |
Algebraic Expression:
|
Scaffold:
|
| 306) Problem #PRAECYJ "PRAECYJ - mens heights" |
|
The distribution of heights of adult American men is approximately Normal with mean 69 inches and standard deviation 2.5 inches. Use the empirical rule to answer the following question: What percent of men are taller than 74 inches? (Citation: The Practice of Statistics. Yates Moore and Starnes, page 137.) |
Multiple Choice:
|
| 307) Problem #PRAECYP "PRAECYP - mens heights b" |
|
Refer back to the problem about men's heights. Between what heights do the middle 95% of men fall? (In inches) |
Multiple Choice:
|
| 308) Problem #PRAD8RF "PRAD8RF - 117681 - If x is an observ..." |
|
If x is an observation from a normal distribution that has a mean value and a standard deviation value, the standardized value of x is z=(x-mean)/standard deviation. A standardized value is often called a z-score. The standard normal distribution is the normal distribution N(2,4) with mean of 2 and standard deviation of 4. Table A is a table of areas under the standard normal curve. The table entry for each value z is the area under the curve to the left of z. Do not make the common mistake of looking up a z-value in Table A and then reporting the entry corresponding to that z-value without knowing if the problem asks for the area to the left or right of that z-value. To make sure you do not fall for this common mistake make sure you always sketch the standard normal curve, mark the z-value, and shade the area you are looking for. Sometimes we want to find the observed value with a given proportion of the observations above or below it. To do this, use Table A backward. Look in the body of the table to find the given proportion, and read the corresponding z value from the left column and top row. Then plug in z, mean, and the standard deviation into the equation to solve for x. Now lets begin: Your class has a test and you score in the top 20th percentile. If the class scores are normally distributed and have a mean of 75 and a standard deviation of 5, what was your score? |
Multiple Choice:
|
|
Hints: |
|
when you find the z-score of 80%, set that number equal to: z=(x+mean)/ standard deviation |
| 309) Problem #PRAEAR4 "PRAEAR4 - 119623 - Gabe measured the..." |
|
Gabe measured the heights of all the kids in his AP Stats class. the heights are normally distributed with a mean of 66 inches and a standard deviation of 2 inches. what fraction of the students are taller than 71 inches? round to the nearest ten-thousandth. |
Algebraic Expression:
|
|
Hints: |
|
|
|
|
| 310) Problem #PRAD9NR "PRAD9NR - 118558 - There are 2400 st..." |
|
There are 2400 students at a school. Every student takes a test and the scores are normally distributed with a mean score is 80 and with a standard deviation of 8. What number of students received a grade above 95? Round to the nearest whole number. |
Algebraic Expression:
|
Scaffold:
|
Scaffold:
|
Scaffold:
|
Scaffold:
|
| 311) Problem #PRAEBS9 "PRAEBS9 - 120620 - Suppose the weigh..." |
|
Suppose the weight of cookies is normally distributed with a mean of 17 ounces and standard deviation of .5 ounces. If the company wants to keep the mean at 17 ounces but adjust the standard deviation so that only 3% of the cookies weigh less than 15 ounces. What does the new standard deviation need to be? |
Multiple Choice:
|
|
Hints: |
|
|
| 312) Problem #PRAD9M3 "PRAD9M3 - 118537 - A random var..." |
|
A)
A random variable X has the following distribution N(10, 5) and is normally distributed. Find: Probability that X>15 round to the nearest thousandth |
Exact Match (case sensitive):
|
|
Hints: |
|
|
|
|
|
B)
Referring to the previous question, what is the probability when P=12? |
Algebraic Expression:
|
|
Hints: |
|
|
|
|
| 313) Problem #PRAEAW7 "PRAEAW7 - 119781 - &nbs..." |
   PLOT A PLOT B PLOT C Which of these plots is normally distributed? |
Multiple Choice:
|
| 314) Problem #PRAD8XP "PRAD8XP - 117874 - A sub shop advert..." |
|
A sub shop advertises that they put .6 pounds of meat in their subs. When a group of subs were randomly selected, the amount of meat is normally distributed with a mean of .5 pounds and a standard deviation of .02 pounds. What percentage of subs have between .49 pounds and .55 pounds of meat? Round to nearest whole percent. |
Exact Match (case sensitive):
|
|
Hints: |
|
|
|
|
| 315) Problem #PRAEDMB "PRAEDMB - 122358 - In a normal distr..." |
|
In a normal distribution, find the mean when the standard deviation is 6 and 3.5% of the area lies to the left of 90. |
Multiple Choice:
|
|
Hints: |
|
|
| 316) Problem #PRAEAWM "PRAEAWM - 119763 - If I am 2 standar..." |
|
If I am 2 standard deviations above the mean, what is my z-score? |
Exact Match (case sensitive):
|
|
Hints: |
|
|
| 317) Problem #PRAECY6 "PRAECY6 - 121764 - Suppose a group o..." |
|
Suppose a group of students take a test and the scores are normally distributed with a mean equal to 85 and a variance of 144. What percentage of the studnets score better than a 90? Round to nearest whole percent. |
Multiple Choice:
|
|
Hints: |
|
|
| 318) Problem #PRAEDMH "PRAEDMH - 122364 - Watermelons are n..." |
|
Watermelons are normally distributed with a mean of 4 pounds and a standard deviation equal to .03 pounds. What percentage of watermelons will weigh more than 3 pounds? |
Multiple Choice:
|
| 319) Problem #PRAEDQ4 "PRAEDQ4 - 122475 - if the following ..." |
|
if the following variable Y has the distribution N(150,25) and is normally distributed Find: probability that X< 130 round to the nearest ten-thousandth |
Algebraic Expression:
|
| 320) Problem #PRAEDMX "PRAEDMX - 122377 - The weights of me..." |
|
The weights of members of a football team are normally distributed with a mean of 250 pounds and a standard deviation of 10 pounds. What percentage of players weigh less than 235 pounds? |
Multiple Choice:
|
| 321) Problem #PRAEDQF "PRAEDQF - 122455 - If Gabe goes hiki..." |
|
If Gabe goes hiking in the woods everyday and the time lengths of his hikes are normally distributed with a mean of 120 minutes (2 hours) and a standard deviation of 30 minutes, what percent of his nature hikes take more than 3 hours (180 minutes)? round to the nearest ten-thousandth. |
Multiple Choice:
|
| 322) Problem #PRAEDRA "PRAEDRA - 122481 - The 68-95-99.7 Ru..." |
|
The 68-95-99.7 Rule 68% of observations falls within 1 standard deviation of the mean 95% of observations fall within 2 standard deviations of the mean 99.7% of observations fall within 3 standard deviations of the mean if a random variable X is normally distributed with a distribution of N(25, 5) what percent of observations lie below the number 35? |
Multiple Choice:
|
| 323) Problem #PRAEBTF "PRAEBTF - 120626 - An ice cream comp..." |
|
An ice cream company advertises that it puts 0.2 lb of real chocolate chips in its ice cream. In fact, the amount of chocolate chips on a sample of randomly selected chocolate chip ice cream has a mean value of 0.25 lb and a standard deviation of 0.02 lb. What percentage of ice cream has between 0.19 and 0.26 lbs of chocolate chips? |
Algebraic Expression:
|
Scaffold:
|
Scaffold:
|
Scaffold:
|
Scaffold:
|
Scaffold:
|
Scaffold:
|
| 324) Problem #PRAEBS7 "PRAEBS7 - 120618 - A random variable..." |
|
A random variable X has the following distribution: N(40, 7). Find P(X>30). |
Multiple Choice:
|
Scaffold:
|
Scaffold:
|
| 325) Problem #PRAEDNW "PRAEDNW - 122407 - Michael takes AP ..." |
|
Michael takes AP Statistic. During the first term has scored an average of 85% on his exams with a standard deviation of 3%. On how many of his exams has he scored at least 88%? |
Algebraic Expression:
|
Scaffold:
|
Scaffold:
|
Scaffold:
|
| 326) Problem #PRAECY5 "PRAECY5 - 121763 - Suppose that the ..." |
|
Suppose that the duration of a particular type of criminal trial is known to be normally distributed with a mean of 21 days and a standard deviation of 7 days. 60% of all of these types of trials are completed within how many days? Round to the nearest day. |
Algebraic Expression:
|
Scaffold:
|
Scaffold:
|
| 327) Problem #PRAEDN3 "PRAEDN3 - 122412 - At the 2010 Massa..." |
|
At the 2010 Massachusetts Division 1 State Championship meet for Track and Field 25 girls competed in the 200 meter dash. With an average time of 27.12 seconds and a standard deviation of 0.2 seconds, what percent of the girls ran with a time of 26.8 seconds or faster? |
Algebraic Expression:
|
|
Hints: |
|
|
Scaffold:
|
Scaffold:
|
Scaffold:
|
| 328) Problem #PRAECYU "PRAECYU - 121754 - Smith's Store sel..." |
|
Smith's Store sells 600 Christmas trees during the month of December. With a mean price of $50 and a standard deviation of 10, what percent of the Christmas trees cost more than $58? |
Algebraic Expression:
|
Scaffold:
|
Scaffold:
|
Scaffold:
|
Scaffold:
|
Scaffold:
|
| 329) Problem #PRAECY7 "PRAECY7 - 121765 - Nancy gives out c..." |
|
Nancy gives out candy on Halloween every year. Over the past 5 years the average amount of candy that she gave out was 100 candy bars with a standard deviation of 4. What is the proportion that Nancy will give out at least 97 candy bars this year? |
Algebraic Expression:
|
|
Hints: |
|
|
| 330) Problem #PRAEBTE "PRAEBTE - 120625 - Among first year ..." |
|
Among first year students at a certain university, scores on the verbal SAT follow the normal curve. The average is around 500 and the SD is about 100. Tatiana took the SAT, and placed at the 85% percentile. What was her verbal SAT score? UCLA Statistics, http://wiki.stat.ucla.edu/socr/index.php/EBook_Problems_Normal_Std |
Algebraic Expression:
|
Scaffold:
|
Scaffold:
|
| 331) Problem #PRAD8X7 "PRAD8X7 - 117890 - IQ is normally di..." |
|
IQ is normally distributed with a mean of 100 and a standard deviation of 15. What is the IQ of a person in the top 20% of the data? Round your answer to the nearest whole number. Barbara Illowsky and Susan Dean, "Collaborative Statistics," Connexions, March 22, 2010, http://cnx.org/content/col10522/1.38/ |
Algebraic Expression:
|
|
Hints: |
|
|
| 332) Problem #PRAD9MZ "PRAD9MZ - 118535 - In the 1992 presi..." |
|
In the 1992 presidential election, Alaska's 40 election districts averaged 1956.8 votes per district for President Clinton. The standard deviation was 572.3. (There are only 40 election districts in Alaska.) The distribution of the votes per district for President Clinton was bell-shaped. What is the probability that a district has 2000 votes? (Source: The World Almanac and Book of Facts) |
Multiple Choice:
|
Scaffold:
|
Scaffold:
|
Scaffold:
|
| 333) Problem #PRAEAWR "PRAEAWR - 119767 - Terri Vogel, an a..." |
|
Terri Vogel, an amateur motorcycle racer, averages 129.71 seconds per 2.5 mile lap (in a 7 lap race) with a standard deviation of 2.28 seconds . The distribution of her race times is normally distributed. Find the percent of her laps that are completed in less than 130 seconds. Barbara Illowsky and Susan Dean, "Collaborative Statistics," Connexions, March 22, 2010, http://cnx.org/content/col10522/1.38/ |
Multiple Choice:
|
Scaffold:
|
Scaffold:
|
Scaffold:
|
Scaffold:
|
| 334) Problem #PRAD8W5 "PRAD8W5 - 117857 - According to a st..." |
|
According to a study done by De Anza students, the height for Asian adult males is normally distributed with an average of 66 inches and a standard deviation of 2.5 inches. Suppose one Asian adult male is randomly chosen. What is the height of a man in the 40th percentile? (only answer in a number, leave out "inches") Barbara Illowsky and Susan Dean, "Collaborative Statistics," Connexions, March 22, 2010, http://cnx.org/content/col10522/1.38/ |
Algebraic Expression:
|
Scaffold:
|
Scaffold:
|
Scaffold:
|
Scaffold:
|
| 335) Problem #PRAD963 "PRAD963 - 119064 - The grade point a..." |
|
The grade point averigaes of the students at the University of Houlihan are approximately normally distributed with mean equal to 3.0 and standard deviation equal to 0.2. What percentage of the students will possess a grade point average greater than 3.5? |
Algebraic Expression:
|
Scaffold:
|
Scaffold:
|
| 336) Problem #PRAEAR6 "PRAEAR6 - 119625 - Suppose that weig..." |
|
Suppose that weights of bags of potato chips coming from a factory follow a normal distribution with mean 12 ounces and standard deciation 0.6 ounces. If the manufacturer wants to keep the mean at 12 ounces but adjust the standard deviation so that only 4% of the bags weigh less than 11 ounces, what does the new standard deviation need to be? Round to the nearest hundredth. |
Algebraic Expression:
|
Scaffold:
|
Scaffold:
|
Scaffold:
|
Scaffold:
|
|
Hints: |
|
|
| 337) Problem #PRAD977 "PRAD977 - 119099 - In China, 4-year-..." |
|
In China, 4-year-olds average 3 hours a day unsupervised. Most of the unsupervised children live in rural areas, considered safe. Suppose that the standard deviation is 1.5 hours and the amount of time spent alone is normally distributed. We randomly survey one Chinese 4-year-old living in a rural area. Find the probability that the child spends less than 1 hour per day unsupervised. Barbara Illowsky and Susan Dean, "Collaborative Statistics," Connexions, March 22, 2010, http://cnx.org/content/col10522/1.38/ |
Algebraic Expression:
|
Scaffold:
|
Scaffold:
|
Scaffold:
|
| 338) Problem #PRAEABS "PRAEABS - 119210 - In a certain norm..." |
|
A)
In a certain normal distribution, 1.25% of the area lies to the left of 33 and 1.25% lies to the right of the 39. Find the mean. |
Algebraic Expression:
|
|
Hints: |
|
|
|
B)
Referring to the question above, find the standard deviation to the nearest hundredth. |
Algebraic Expression:
|
Scaffold:
|
Scaffold:
|
Scaffold:
|
Scaffold:
|
| 339) Problem #PRAEBTD "PRAEBTD - 120624 - Find the probabil..." |
|
Find the probability, P(Z=1.7). |
Algebraic Expression:
|
|
Hints: |
|
|
| 340) Problem #PRAD9MW "PRAD9MW - 118532 - The percent of fa..." |
|
The percent of fat calories that a person in America consumes each day is normally distributed with a mean of about 36 and a standard deviation of 10. Suppose that one individual is randomly chosen. Find the probability that the percent of fat calories a person consumes is more than 40. Barbara Illowsky and Susan Dean, "Collaborative Statistics," Connexions, March 22, 2010, http://cnx.org/content/col10522/1.38/ |
Algebraic Expression:
|
Scaffold:
|
Scaffold:
|
Scaffold:
|
Scaffold:
|
Scaffold:
|